

1 Before you start
This is not graded, and it does not count towards anything. Answer every question even if you are only guessing — having a go at something before you have been taught it is one of the best ways to remember it afterwards. The lesson ends with another short check, and there you will be shown the correct answer for anything you missed. Choose an option for every question and confidence rating, then click Submit answers.
You want one row per treatment arm holding that arm's mean HbA1c. Which pair of verbs does this?
The name for the grouped-summary pattern is split-apply-combine. Which step does summarise() perform?
Why should you add n() inside summarise() when you report a group mean?
You run summarise(mean_hba1c = mean(hba1c)) on the clinic table where hba1c has some missing values, and every result comes back as NA. What is the fix?
A demographics table has all 100 patients; a labs table has only the 80 who returned. You must keep every patient in the result. Which join do you use?
You inner_join() a demographics table with a labs table. What happens to a patient who has no lab result?
In left_join(demographics, labs, by = "patient_id"), what does the by argument name?
You meant to keep every patient but accidentally used inner_join() instead of left_join() on a labs table missing some patients. What is the clinical consequence?
I can produce a per-group summary table with group_by() and summarise() using the split-apply-combine pattern, and include a count with n() beside every mean.
I can pass na.rm = TRUE to mean() inside summarise() so a group summary is not silently returned as NA when values are missing.
I can choose left_join() versus inner_join() on a shared key so no patient silently disappears from my sample.
2 Introduction
In Part II you reshaped a single table one row and one column at a time — you filtered, selected, and added variables with mutate(). That is enough when the answer lives inside one table. Real clinical questions rarely do. You need the mean HbA1c per treatment arm, and a demographics table stitched to a labs table so every result carries its patient's age. This part gives you those two moves.
This part of the module covers two wrangling skills you reach for in almost every analysis:
- Grouped summaries — group_by() then summarise() to collapse many rows into one row per group, such as the mean HbA1c per treatment arm, reported beside a count.
- Joins — left_join() and inner_join() to combine a demographics table with a labs table on a shared key, keeping the rows you intend to keep.
By the end of this part you will be able to produce a per-group summary table with counts using the split-apply-combine pattern, and choose the right join so no patient silently disappears from your sample.
Try every snippet in the R Scratchpad on the right — the dataset diabetes_clinic.csv is already loaded for the grouped summaries, and you can build the small demographics and labs tables yourself with tibble() to watch each join behave.
3 Grouped summaries: split, apply, combine
A grouped summary collapses many rows into one row per group. You name the grouping variable with group_by(), then compute one number per group with summarise(). The pattern has a name: split-apply-combine — split the rows into groups, apply a calculation to each, combine the results into a small table.
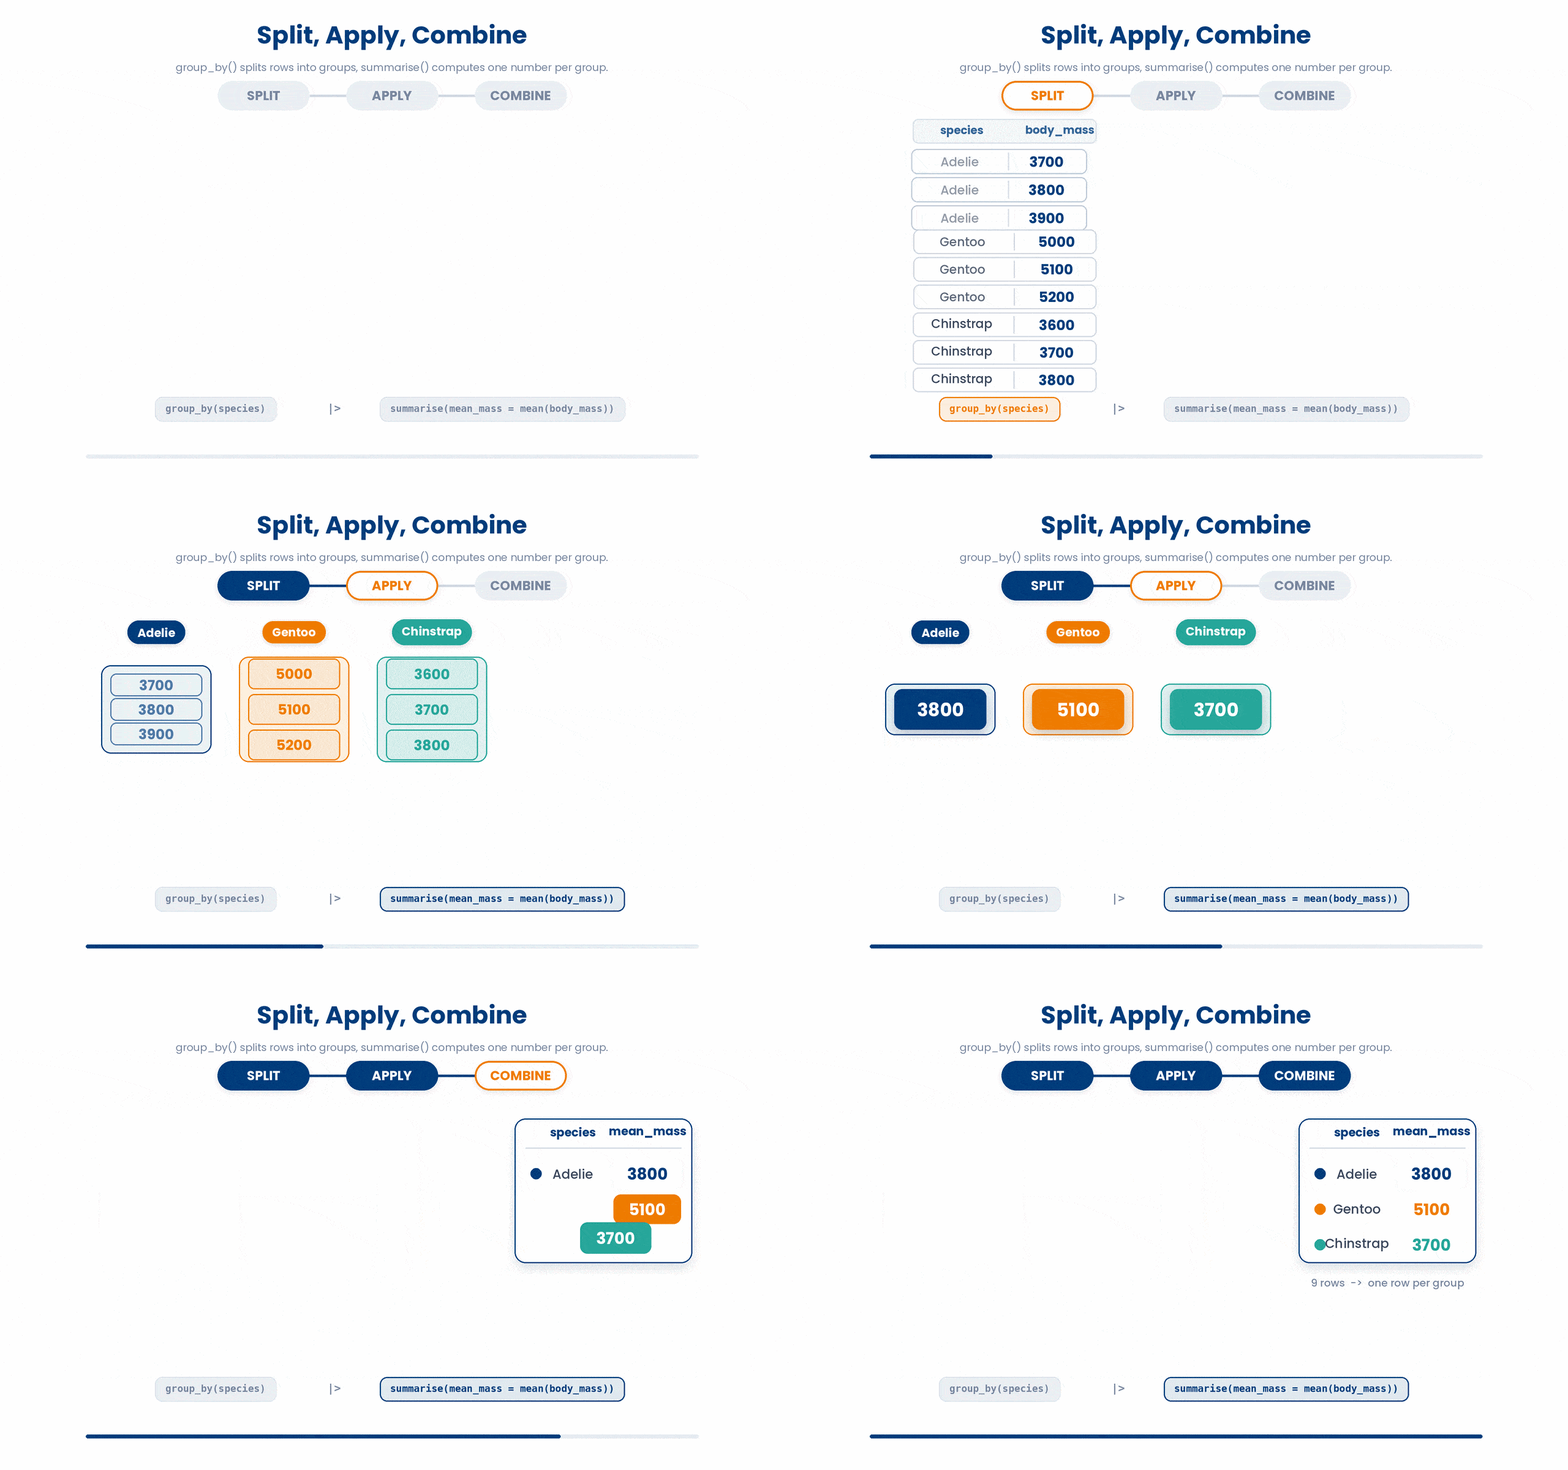
Here is the question made concrete: what is the mean HbA1c in each treatment arm of the diabetes clinic? You split by treatment, apply mean() to each arm's hba1c, and get one row per arm back.
Two details matter. First, this course uses the native pipe |>, which feeds the table on its left into the function on its right. Second, hba1c has missing values, so you must pass na.rm = TRUE to mean() or the answer comes back as NA.
Try this snippet in the R Scratchpad on the right.
library(dplyr)
clinic <- readr::read_csv("diabetes_clinic.csv")
clinic |>
  group_by(treatment) |>
  summarise(mean_hba1c = mean(hba1c, na.rm = TRUE))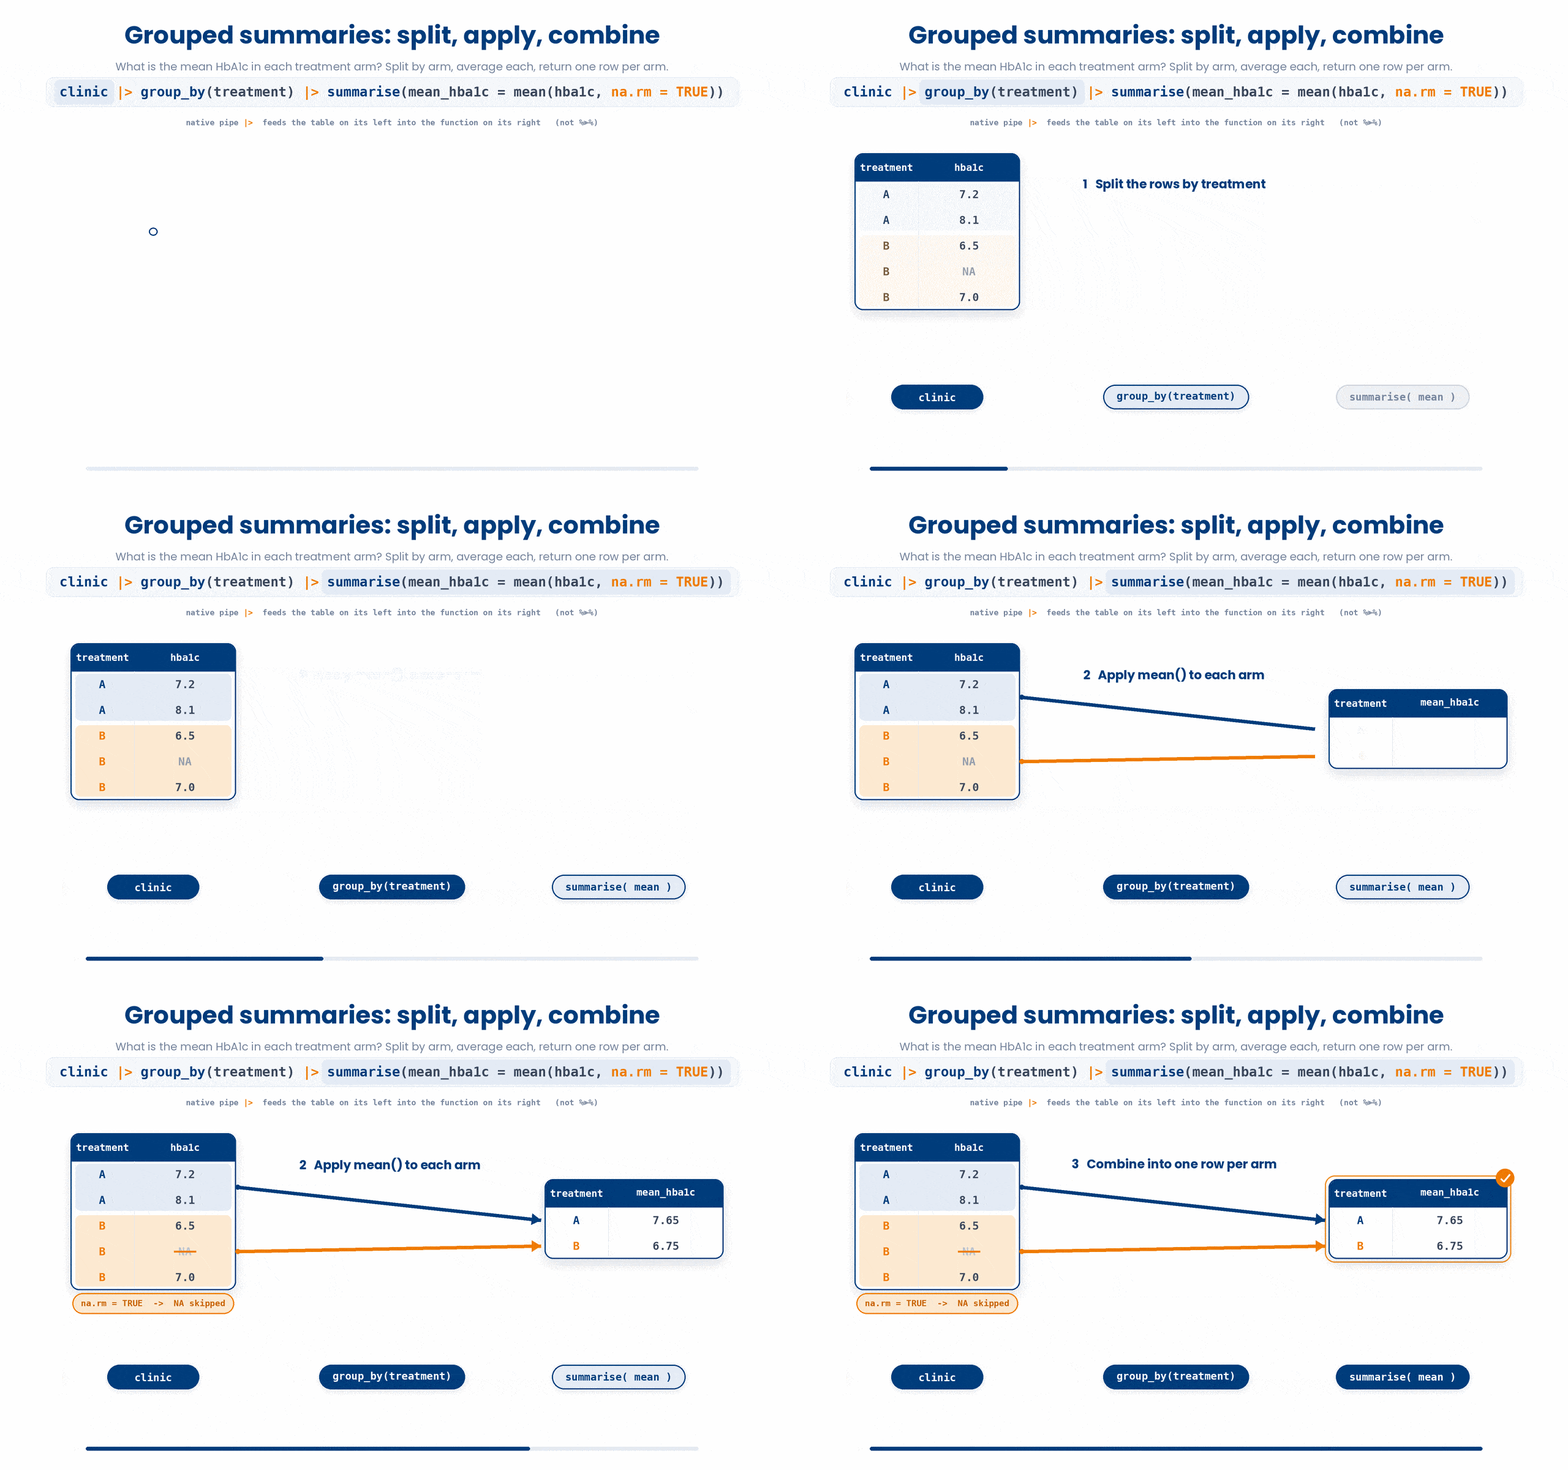
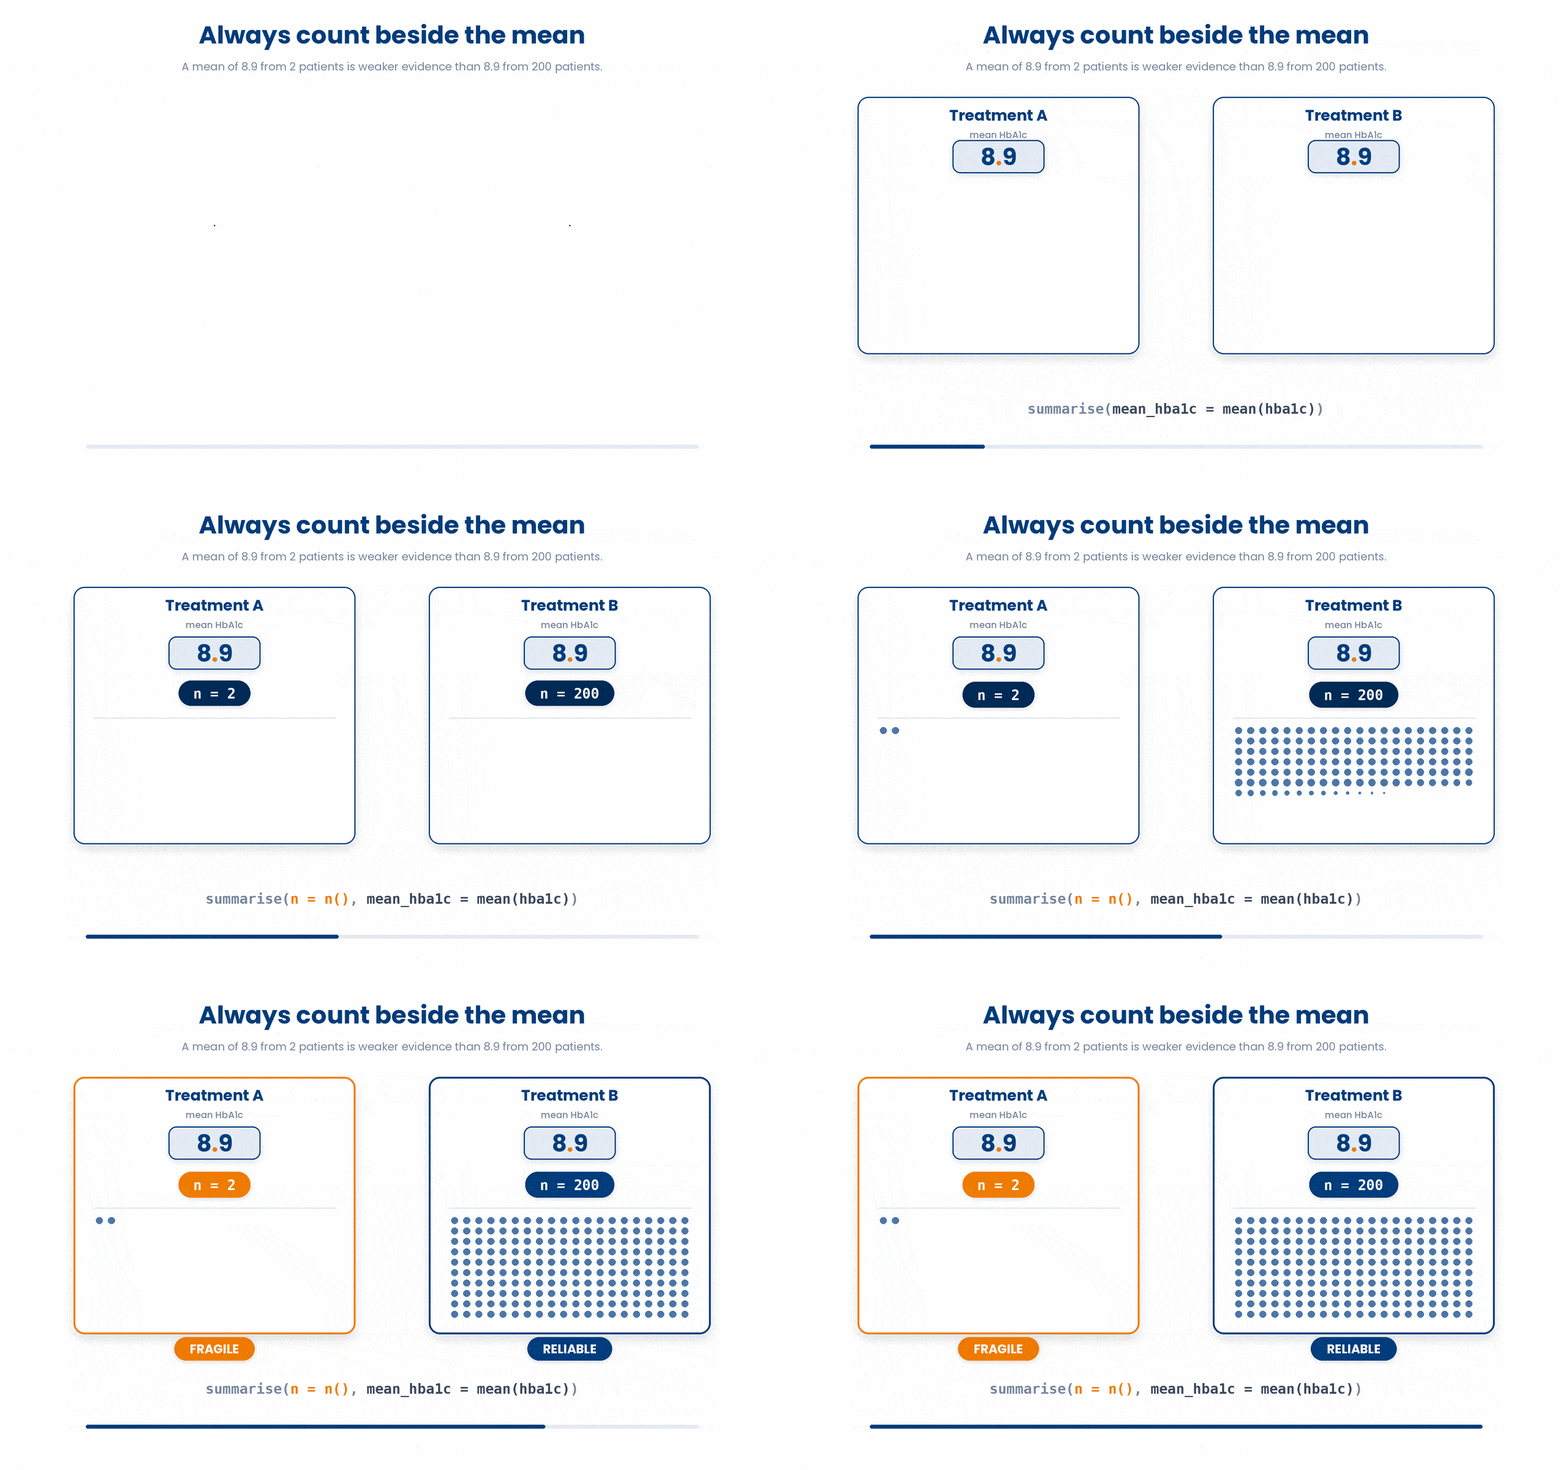
Add n() inside summarise() to count the rows in each group. A summary without a count is dangerous: a mean of 8.9 from two patients is not the same evidence as a mean of 8.9 from two hundred. Always report the count beside the mean.
Try this snippet in the R Scratchpad on the right.
library(dplyr)
clinic <- readr::read_csv("diabetes_clinic.csv")
clinic |>
  group_by(treatment) |>
  summarise(
    n = n(),
    mean_hba1c = mean(hba1c, na.rm = TRUE)
  )
The classic trap is forgetting that summarise() returns a new, smaller table — one row per group, not the original rows. If you still see one row per patient, you reached for mutate() when you wanted summarise(). mutate() keeps every row; summarise() collapses them.
4 Joins: combining two tables on a shared key
A grouped summary works inside one table. Often your information is split across two. A join combines two tables by matching rows on a shared column called the key — here, patient_id. Picture a one-row-per-patient demographics table and a many-rows-per-patient labs table, and you want each lab result to carry its patient's age and sex.
Build the two small tables so you can watch the join behave:
Try this snippet in the R Scratchpad on the right.
library(dplyr)
demographics <- tibble(
  patient_id = c("D001", "D002", "D003"),
  age = c(54, 61, 47)
)
labs <- tibble(
  patient_id = c("D001", "D001", "D002"),
  hba1c = c(7.2, 7.5, 8.1)
)
demographics
labs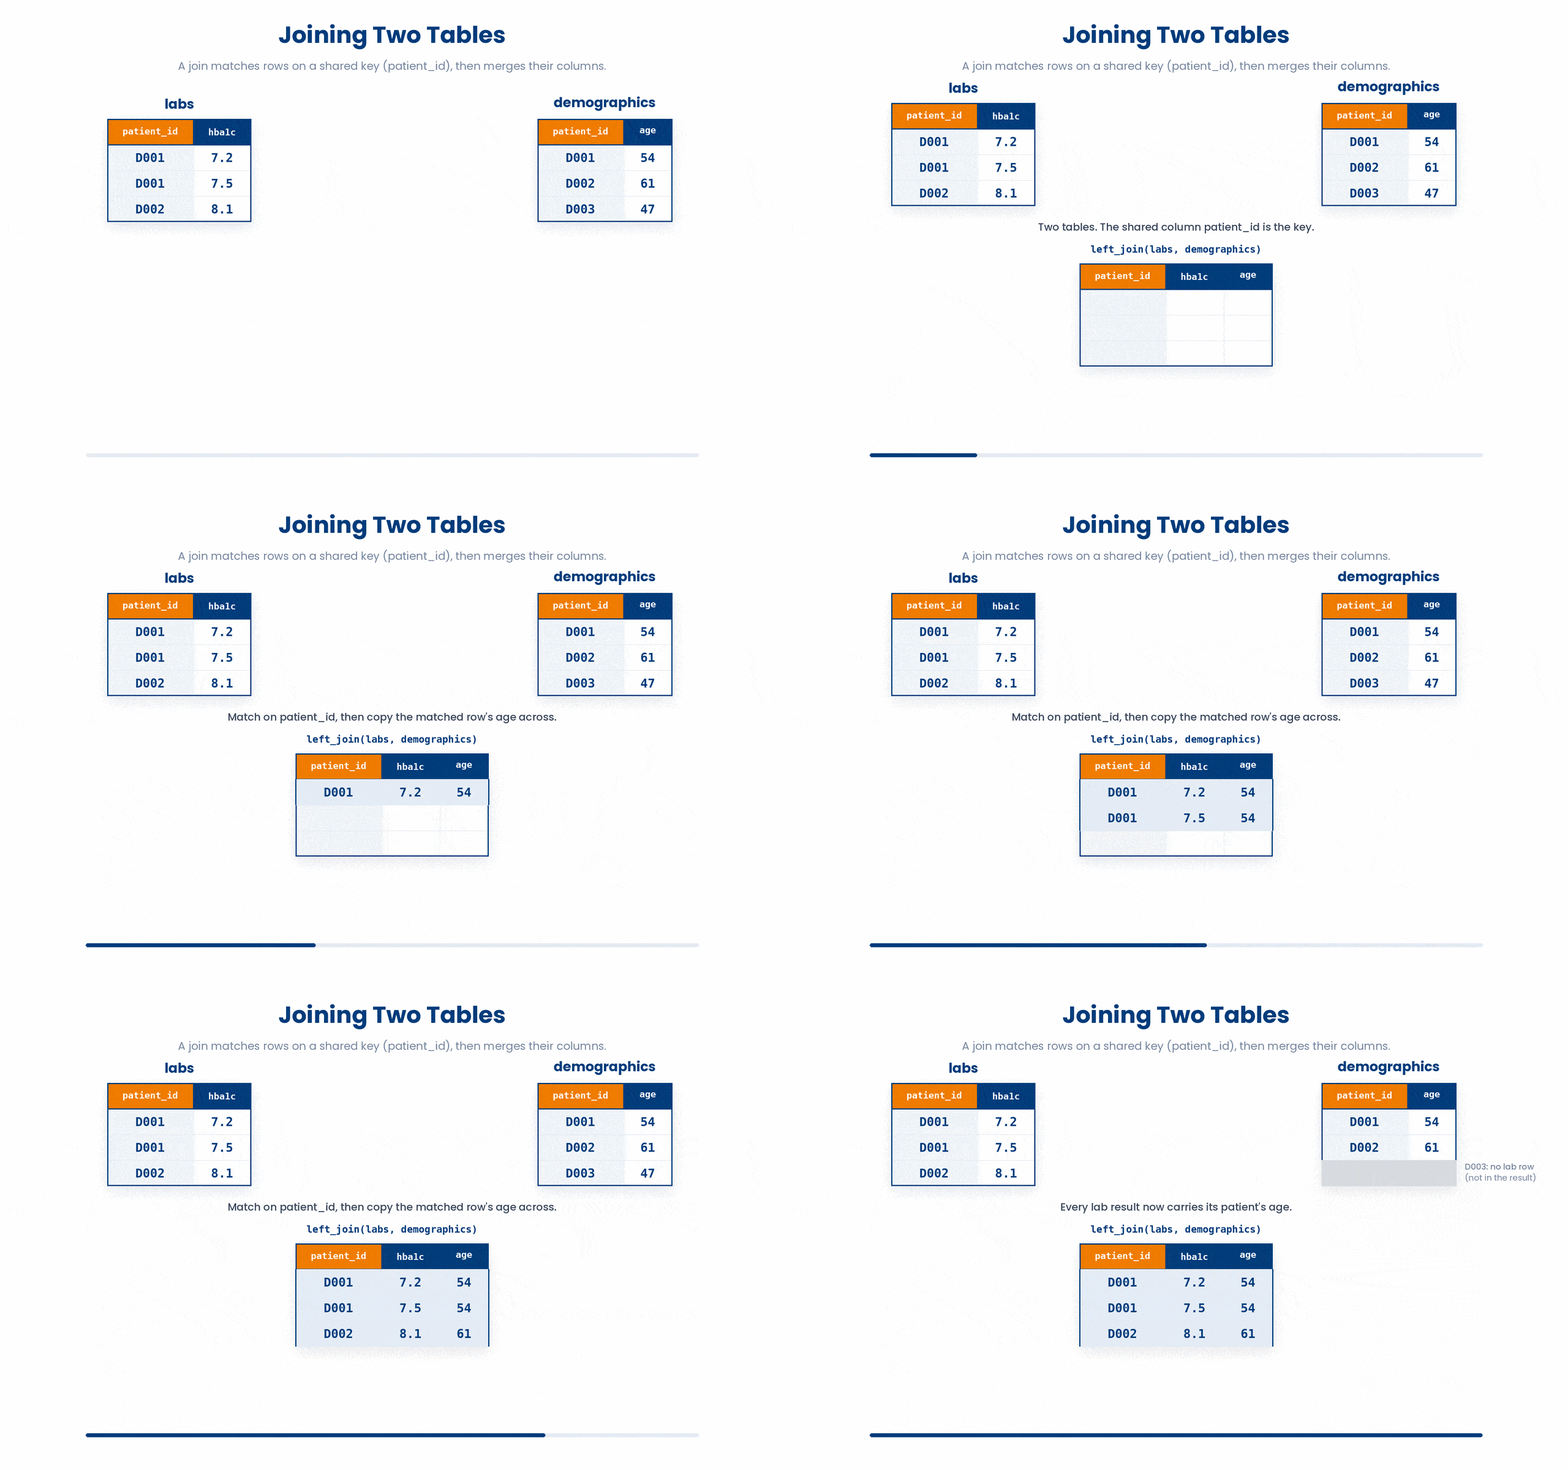
The two joins you will use most differ in which rows they keep. A left_join() keeps every row of the left (first) table, and pulls in matching columns from the right; patients with no labs stay, with NA where the lab would be. An inner_join() keeps only rows that match in both tables; a patient with no labs is dropped entirely.
Try this snippet in the R Scratchpad on the right.
library(dplyr)
demographics <- tibble(
  patient_id = c("D001", "D002", "D003"),
  age = c(54, 61, 47)
)
labs <- tibble(
  patient_id = c("D001", "D001", "D002"),
  hba1c = c(7.2, 7.5, 8.1)
)
left_join(demographics, labs, by = "patient_id")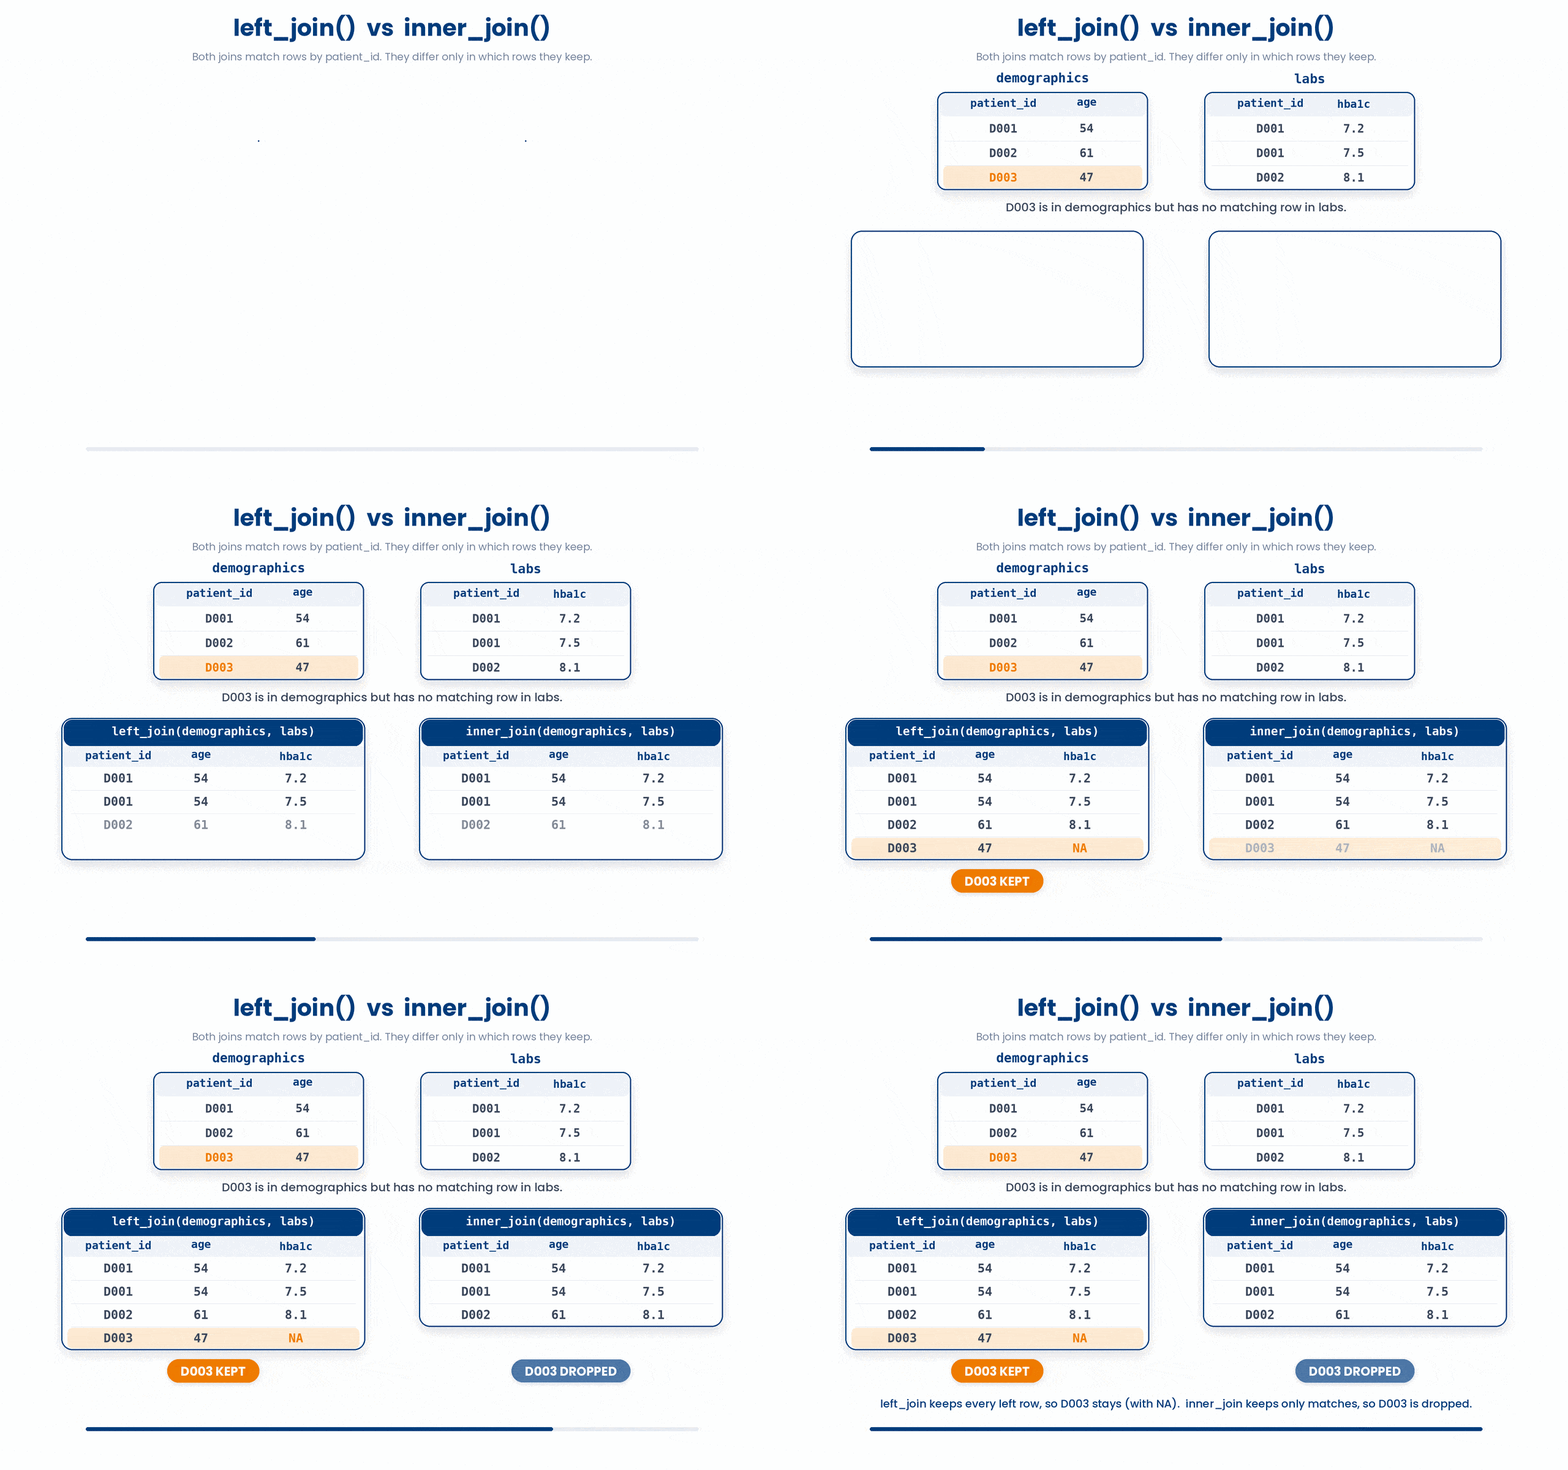
Note D003 has no labs. In the left_join() D003 survives with NA for hba1c; in an inner_join() D003 vanishes. That difference is not cosmetic. Reaching for inner_join() when you meant left_join() silently shrinks your denominator — patients with no labs disappear, and your sample looks smaller and healthier than it really is. When in doubt, left_join() keeps everyone and makes missingness visible as NA.
Try this snippet in the R Scratchpad on the right.
library(dplyr)
demographics <- tibble(
  patient_id = c("D001", "D002", "D003"),
  age = c(54, 61, 47)
)
labs <- tibble(
  patient_id = c("D001", "D001", "D002"),
  hba1c = c(7.2, 7.5, 8.1)
)
inner_join(demographics, labs, by = "patient_id")
5 Check your understanding
You have reached the end of the module. Try the same questions again — your answers here, paired with your pre-test answers, are how we measure what the module taught you. Answer every question and confidence rating, then click Submit and see results to view your score.
You want one row per treatment arm holding that arm's mean HbA1c. Which pair of verbs does this?
The name for the grouped-summary pattern is split-apply-combine. Which step does summarise() perform?
Why should you add n() inside summarise() when you report a group mean?
You run summarise(mean_hba1c = mean(hba1c)) on the clinic table where hba1c has some missing values, and every result comes back as NA. What is the fix?
A demographics table has all 100 patients; a labs table has only the 80 who returned. You must keep every patient in the result. Which join do you use?
You inner_join() a demographics table with a labs table. What happens to a patient who has no lab result?
In left_join(demographics, labs, by = "patient_id"), what does the by argument name?
You meant to keep every patient but accidentally used inner_join() instead of left_join() on a labs table missing some patients. What is the clinical consequence?
I can produce a per-group summary table with group_by() and summarise() using the split-apply-combine pattern, and include a count with n() beside every mean.
I can pass na.rm = TRUE to mean() inside summarise() so a group summary is not silently returned as NA when values are missing.
I can choose left_join() versus inner_join() on a shared key so no patient silently disappears from my sample.
6 Your results
Here is how your post-test answers compare with your pre-test answers. The pre/post pairing is the most reliable way to see what this module actually taught you.
Submit the post-test to see your results.
What is the one thing from this module that is still unclear to you?