

1 Before you start
This is not graded, and it does not count towards anything. Answer every question even if you are only guessing — having a go at something before you have been taught it is one of the best ways to remember it afterwards. The lesson ends with another short check, and there you will be shown the correct answer for anything you missed. Choose an option for every question and confidence rating, then click Submit answers.
You want to remove only the patients whose hba1c is missing, leaving gaps in other columns untouched. Which line does that?
What does drop_na(clinic) return, with no column named?
You use drop_na(clinic, hba1c) to remove patients with a missing HbA1c. What must you also do for an honest analysis?
clinic has 12 rows. After clinic_complete <- drop_na(clinic, hba1c), nrow(clinic_complete) is 10. How many patients did you drop, and where should that number go?
Keeping only the rows with no missing values is called what?
At a diabetes clinic, the sickest patients are the most likely to miss their HbA1c test. You drop every patient with a missing HbA1c and report the mean. What is the main danger?
Missingness is large and clearly related to how sick the patients are. According to this course, what is the right move?
For this bridging course, what is your job when you meet missing data?
I can remove incomplete rows with drop_na() as a counted decision, checking nrow() before and after and reporting how many patients I dropped.
I can explain why a complete-case analysis can bias a clinical result rather than merely weaken it, using an example like the sickest patients missing their HbA1c test.
I can say when dropping rows is the wrong move, and I know that for this course my job is to detect, count, and report missingness honestly.
2 Introduction
In Part III you found and counted missing values with is.na() and sum(is.na(x)), and you fixed mean() with na.rm = TRUE. Now you decide what to do about those gaps — and that decision is where an honest analysis is won or lost.
Removing incomplete rows is easy to type and easy to get wrong. Do it carelessly and you can quietly delete your sickest patients and report a reassuring average that is simply not true. This part covers three ideas:
- Dropping rows as a counted decision — removing incomplete rows on purpose with drop_na(), counting the rows before and after so the number you removed goes into your write-up.
- Complete-case bias — why keeping only the complete rows can shift your answer in a predictable direction, not merely make it less precise.
- Detect, count, report — the safe habit for this course: look at who is missing, decide whether the gaps are random, and know when dropping rows is the wrong move.

By the end of this part you will be able to remove incomplete rows with drop_na() while reporting the count you dropped, explain why a complete-case analysis can bias a clinical result when the missingness is tied to the patients, and say when dropping rows is the wrong move.
Try every snippet in the R Scratchpad on the right — the dataset diabetes_clinic.csv is already loaded, and some of its HbA1c values are missing on purpose so you can watch a drop change the row count and see how the count you report keeps you honest.
3 Removing missing rows as a counted decision
Once you know how many values are missing, you might decide to drop the incomplete rows so the rest of your analysis runs cleanly. The key word is decide: removing rows is a choice you make on purpose and write down, not a reflex.
The tidy tool is drop_na() from the tidyr package. drop_na(clinic) returns a new tibble with every row that has any NA removed; drop_na(clinic, hba1c) removes only rows where the hba1c column is missing, leaving gaps in other columns untouched.
Frame it as a counted decision every time. Count first with sum(is.na(clinic$hba1c)), drop second, then check the new row count with nrow(). The difference between the two row counts is exactly how many patients you removed — and that number belongs in your write-up.
Try this snippet in the R Scratchpad on the right.
library(readr)
library(tidyr)
clinic <- read_csv("diabetes_clinic.csv")
clinic_complete <- drop_na(clinic, hba1c)
nrow(clinic)
nrow(clinic_complete)Now the trap that even experienced analysts fall into: treating drop_na() as a free, neutral fix. It is not free. Dropping rows always costs you data, and sometimes it costs you more than precision — it can bend your answer. The next section explains why.
4 Why dropping rows can bias a clinical result
When you keep only the rows with no missing values, you are doing what statisticians call a complete-case analysis. It is tempting because it is simple. The danger is that it quietly assumes the patients with missing data are just like the patients without — and in clinical work that assumption is often false.
Here is the heart of it. If values are missing for reasons connected to the patients themselves, then the patients you drop are different from the ones you keep. Dropping them does not just lose you a little precision — it can shift your answer in a specific direction. That shift is called bias.
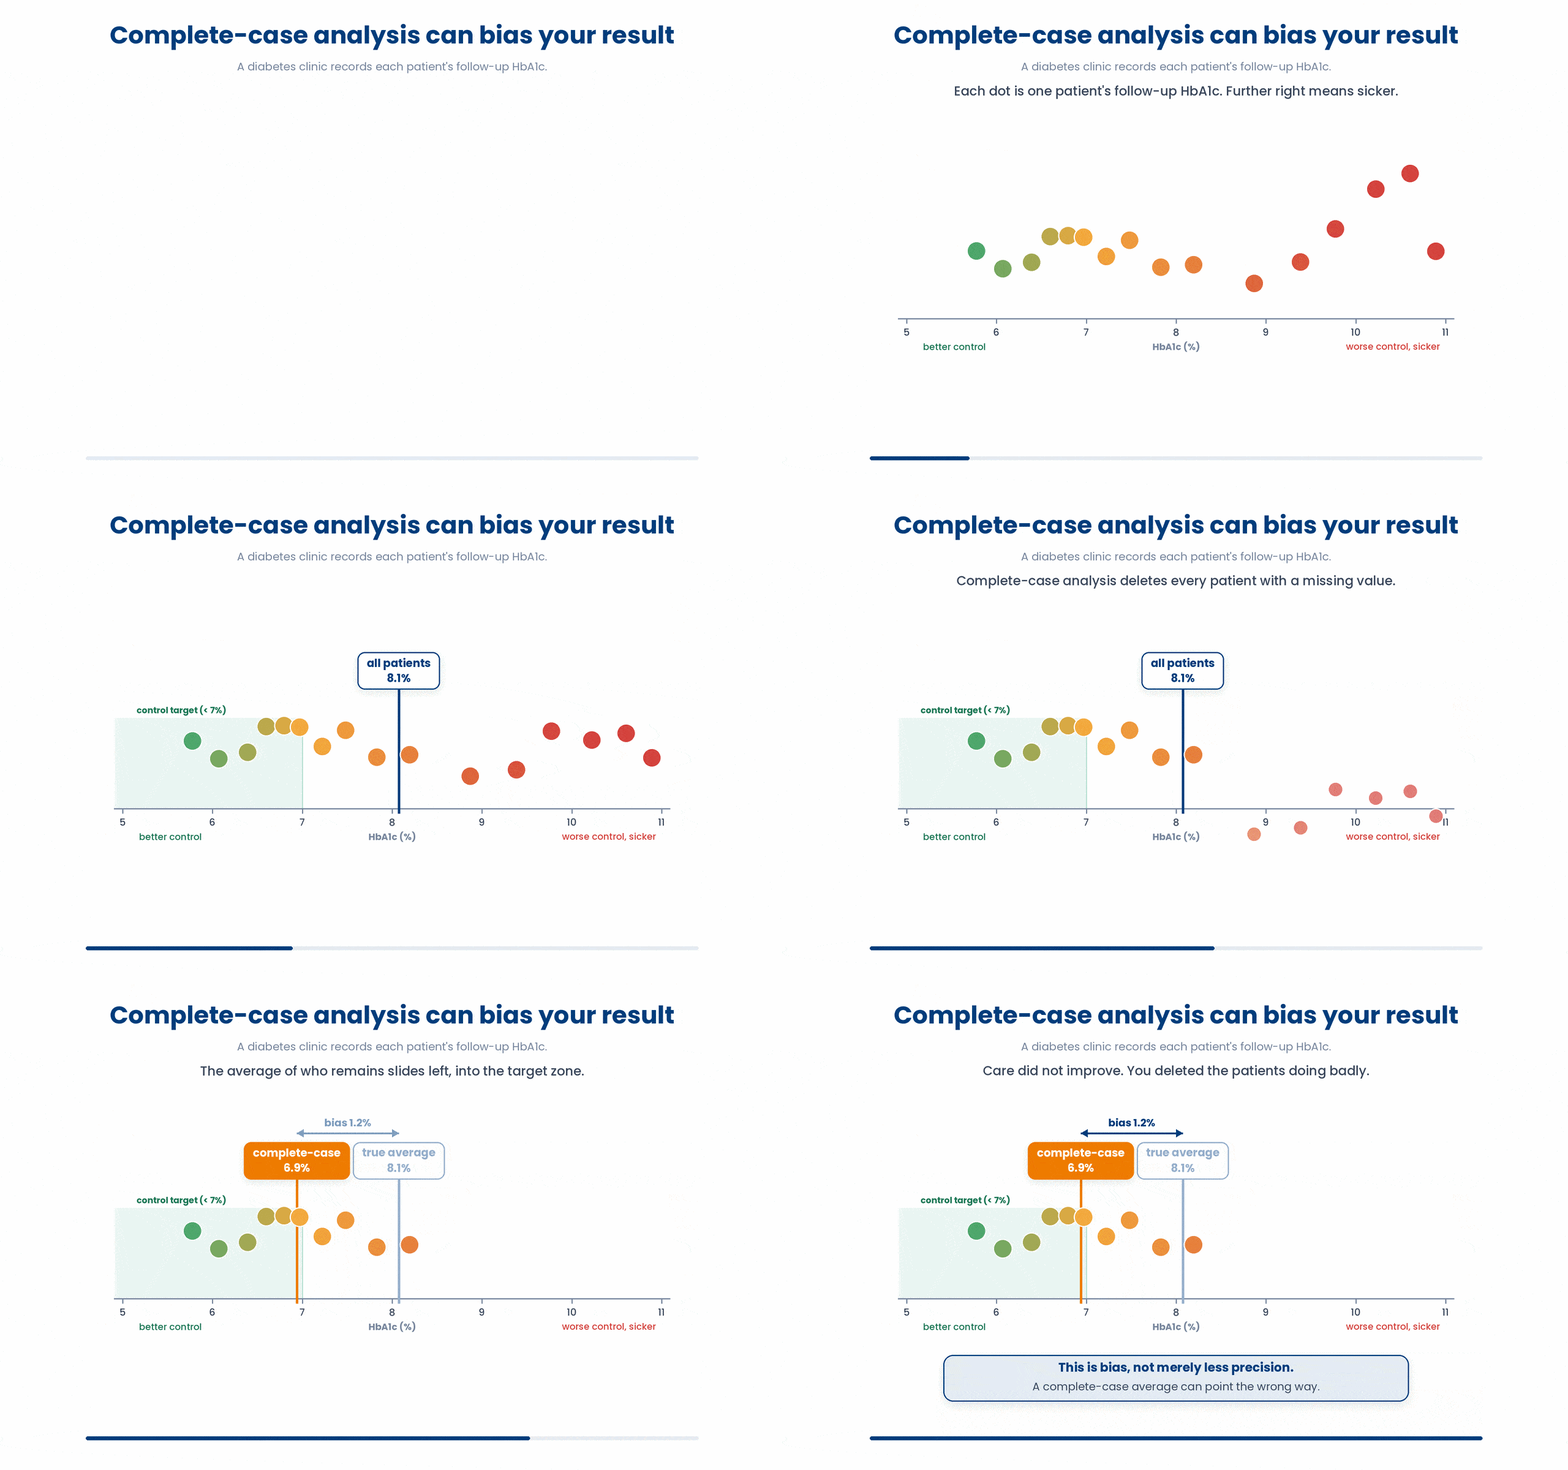
Make it concrete. Suppose the sickest diabetic patients are the ones who miss their follow-up HbA1c tests, because they are too unwell to come in. Drop every patient with a missing HbA1c, and you have thrown out your sickest cases. The average HbA1c of who remains looks reassuringly low — not because the clinic is doing well, but because you deleted the people doing badly. The result is biased, not merely less precise.
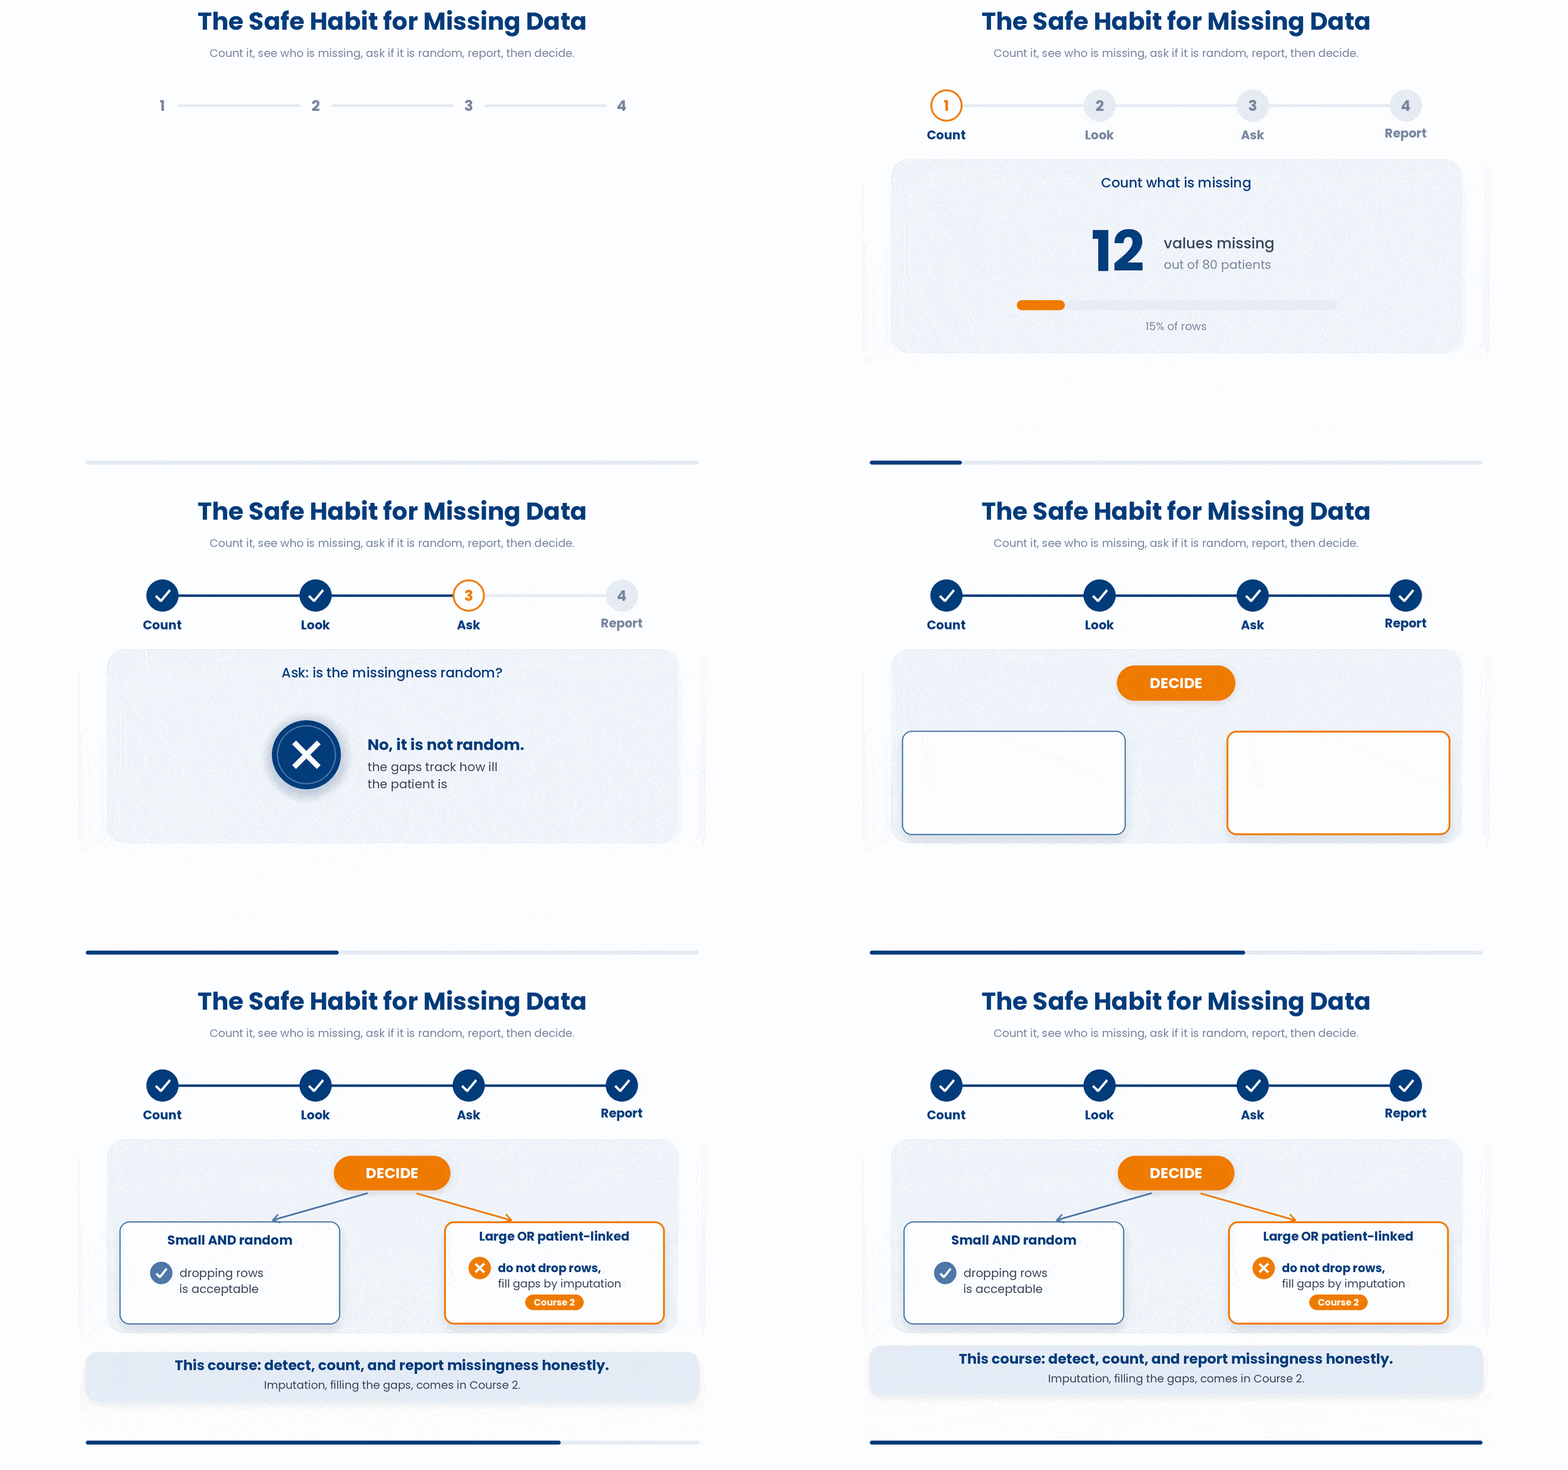
So the safe habit is: count what is missing, look at who is missing and ask whether the missingness is random, report the count, and only then decide. When missingness is large or clearly related to the patients, dropping rows is the wrong move.
What is the right move in that case? A technique called imputation — filling the gaps with statistically principled estimates instead of deleting rows. That is genuinely useful and genuinely easy to do badly, so we defer it to Course 2. For this course, your job is to detect, count, and report missingness honestly — not to impute.
5 Put it together
This Parsons problem gives you the right lines in the wrong order, plus a few lines that do not belong. Drag the correct lines into order — count the missing values before you drop anything — and leave the wrong ones in the bank.
All the lines you need are in the Line bank on the left — some may be distractors you should leave behind. Drag the lines you need into the Your solution column on the right, in the correct order, then click Check.
Task: Switch on the packages, read the clinic file, count the missing HbA1c values, drop those rows into clinic_complete, then show the new row count.
sum(is.na(clinic$hba1c))clinic$hba1c == NAclinic_complete <- drop_na(clinic, hba1c)library(readr)library(tidyr)nrow(clinic_complete)clinic <- read_csv("diabetes_clinic.csv")mean(clinic) <- na.rmclinic_complete <- drop_na(clinic$hba1c)
- Drop lines here, in order.
The worked example below fades the support as you go: first you study a full solution on the real clinic data, then you fill the gap, then you solve a fresh one on your own. Watch the punchline at the end — it is the whole point of this part.
Work through this example in three stages. You unlock each stage only after the tutor confirms the previous one. Each stage removes more of the scaffolding — by the end you are writing it yourself.
Problem: The HbA1c column in diabetes_clinic.csv has missing values. Load the data, see that mean() returns NA, count how many are missing, then compute the mean with na.rm = TRUE while reporting the count.
library(readr)
library(tidyr)
clinic <- read_csv("diabetes_clinic.csv")
mean(clinic$hba1c)
sum(is.na(clinic$hba1c))
nrow(clinic)
mean(clinic$hba1c, na.rm = TRUE)- Switch on readr and tidyr, then read the clinic file into an object called clinic
- mean(clinic$hba1c) returns NA because the column has missing values and mean propagates them
- sum(is.na(clinic$hba1c)) counts the gaps and nrow(clinic) gives the total, so you can report how many are missing
- mean(clinic$hba1c, na.rm = TRUE) averages only the patients who have a result
The same solution with key parts replaced by ???.
Fill in every ??? so the code matches the reference,
then ask the tutor to check it.
Your turn: Now go one step further. Use drop_na(clinic, hba1c) to build clinic_complete, then report nrow(clinic) and nrow(clinic_complete) so the count of dropped patients is explicit. Remember: that complete-case mean can be biased if the sickest patients are the ones missing their test.

6 Check your understanding
You have reached the end of the module. Try the same questions again — your answers here, paired with your pre-test answers, are how we measure what the module taught you. Answer every question and confidence rating, then click Submit and see results to view your score.
You want to remove only the patients whose hba1c is missing, leaving gaps in other columns untouched. Which line does that?
What does drop_na(clinic) return, with no column named?
You use drop_na(clinic, hba1c) to remove patients with a missing HbA1c. What must you also do for an honest analysis?
clinic has 12 rows. After clinic_complete <- drop_na(clinic, hba1c), nrow(clinic_complete) is 10. How many patients did you drop, and where should that number go?
Keeping only the rows with no missing values is called what?
At a diabetes clinic, the sickest patients are the most likely to miss their HbA1c test. You drop every patient with a missing HbA1c and report the mean. What is the main danger?
Missingness is large and clearly related to how sick the patients are. According to this course, what is the right move?
For this bridging course, what is your job when you meet missing data?
I can remove incomplete rows with drop_na() as a counted decision, checking nrow() before and after and reporting how many patients I dropped.
I can explain why a complete-case analysis can bias a clinical result rather than merely weaken it, using an example like the sickest patients missing their HbA1c test.
I can say when dropping rows is the wrong move, and I know that for this course my job is to detect, count, and report missingness honestly.
7 Your results
Here is how your post-test answers compare with your pre-test answers. The pre/post pairing is the most reliable way to see what this module actually taught you.
Submit the post-test to see your results.
What is the one thing from this module that is still unclear to you?