

1 Before you start
This is not graded, and it does not count towards anything. Answer every question even if you are only guessing — having a go at something before you have been taught it is one of the best ways to remember it afterwards. The lesson ends with another short check, and there you will be shown the correct answer for anything you missed. Choose an option for every question and confidence rating, then click Submit answers.
When you run an analysis on your own machine, why do R users work inside an RStudio Project?
Which line points to your data in a way that still works when a colleague re-runs the analysis on their own computer?
Which line stores the number 54 in an object called age?
You type x <- 5 but accidentally write x < -5 instead. What does x < -5 actually do?
You want one object holding four patient ages — 54, 61, 47, 73. Which line builds it?
You have ages <- c(54, 61, 47, 73). Which line returns the second patient's age, 61?
A variable records each patient's sex as "M" or "F", with no other values allowed. Which type best represents it in R?
For hba1c <- c(7.2, 8.1, 6.5, 9.4), what does sum(hba1c > 8) return?
I can create and name R objects with <-, and build and summarise a vector of clinical values with c().
I can pull values out of a vector by position with square brackets, remembering that R counts from 1.
I can tell whether a variable should be numeric, character, logical, or a factor, and explain when a category belongs in a factor.
2 Introduction
R is the language working biostatisticians use to clean data, run analyses, and make the figures and tables you see in clinical papers. Before you can analyse anything, you need somewhere to put the data and a way to talk about it — a named value, a column of results, and the type each value carries. This first part builds exactly that vocabulary, the groundwork everything else in the course is built on.
This part of the module covers four foundations you will reach for in every analysis that follows:
- Workbench — how R, RStudio, and an RStudio Project fit together, and why a relative path keeps your analysis reproducible on any machine.
- Objects — storing a value under a name with the assignment arrow <-, so you can use it again later.
- Vectors — holding many values, such as a whole column of ages or lab results, in one object with c(), and pulling values back out by position.
- Data types — telling apart the numeric, character, logical, and factor values that clinical data is made of, and when a category belongs in a factor.
By the end of this part you will be able to create and name R objects with the assignment arrow, build and summarise a vector of clinical values, pull out values by position, and identify what type each variable is — including when a category should be a factor.
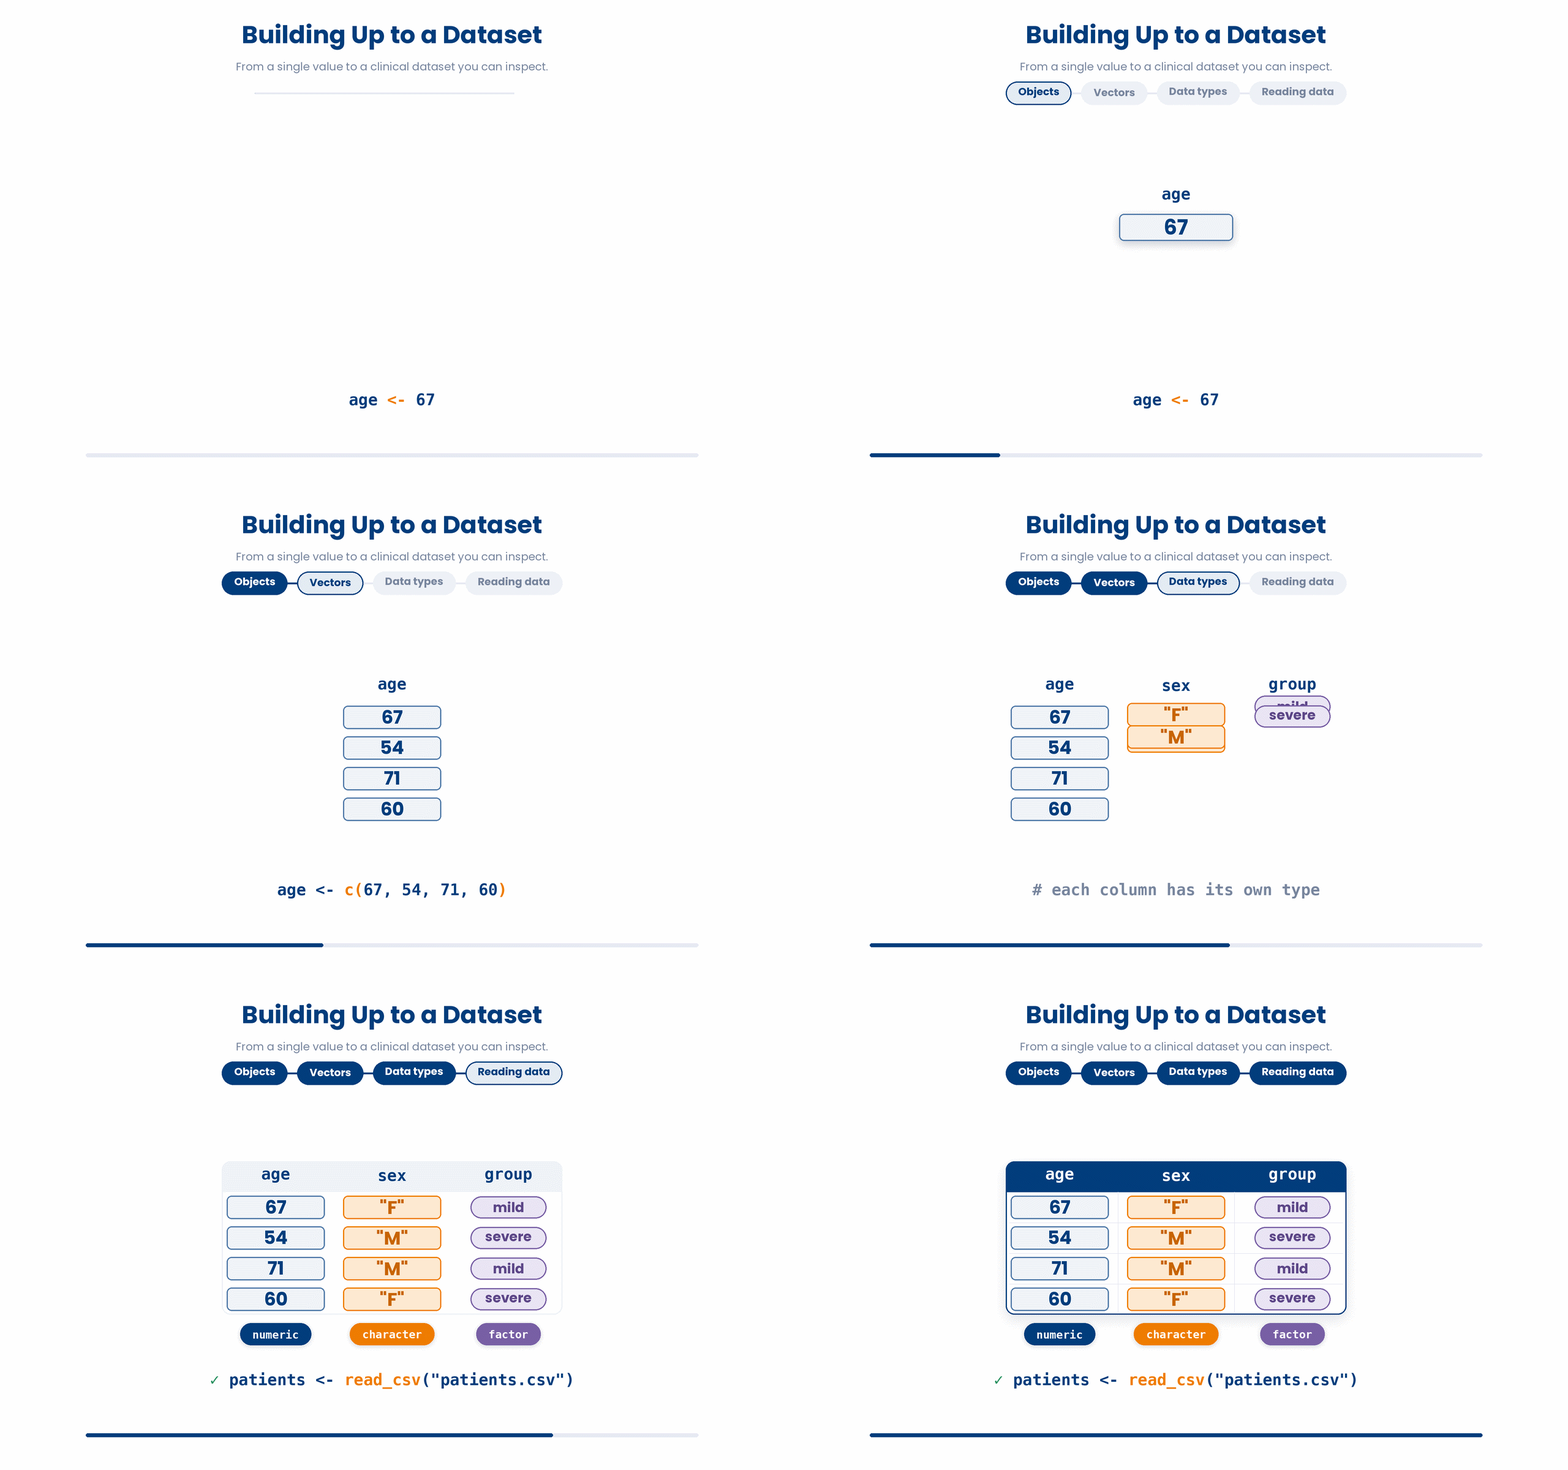
Try every snippet in the R Scratchpad on the right. This part builds its own small vectors by hand with c() and factor(), so it needs no data file — though diabetes_clinic.csv is already loaded and waiting for the next part.
3 R, RStudio, and why you work inside a Project
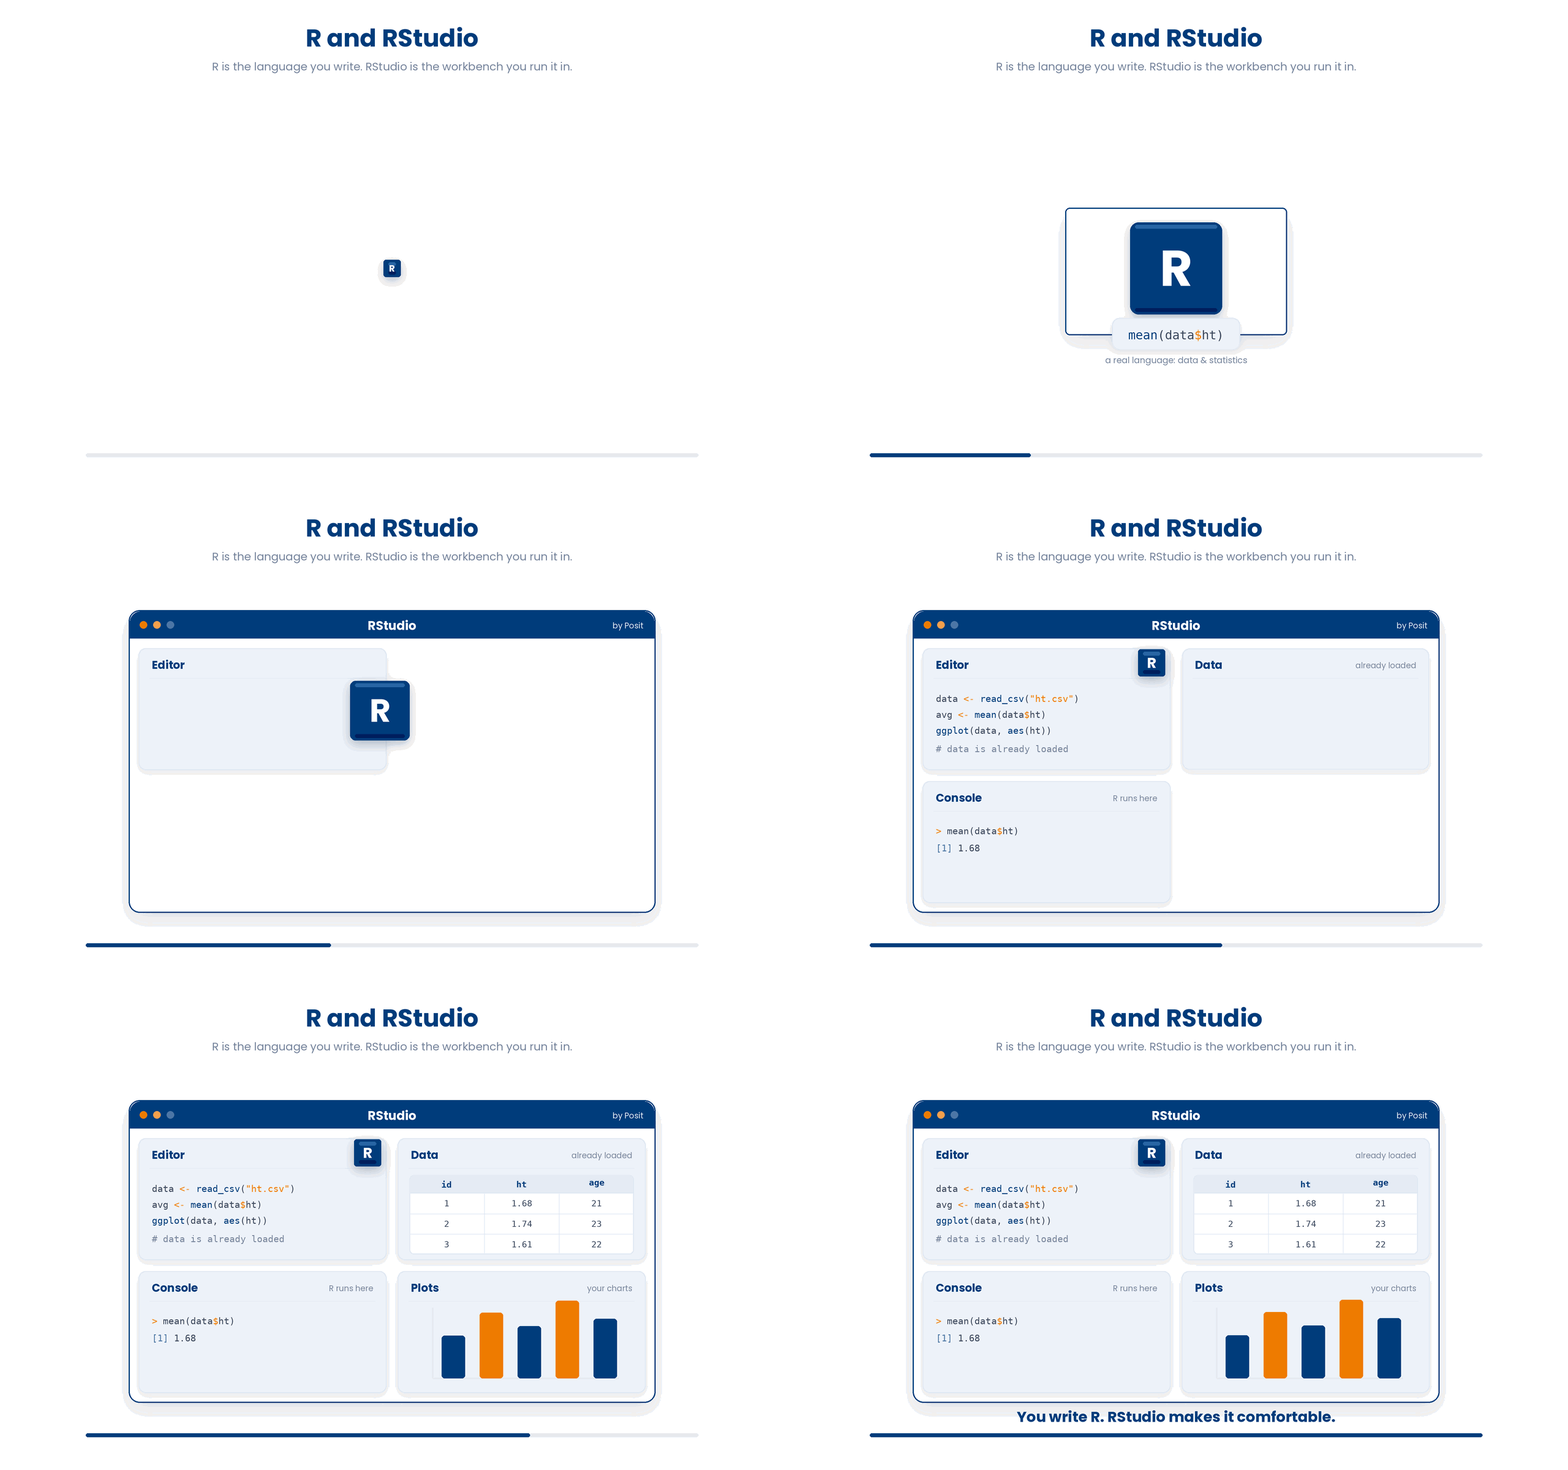
R is a programming language built for data and statistics. RStudio — made by a company called Posit — is the workbench you run R inside: an editor, a console, and panes for your plots and data, all in one window. You write R; RStudio makes it comfortable. In this lesson the workbench is your browser, and the data is already loaded, so you can focus on the language.
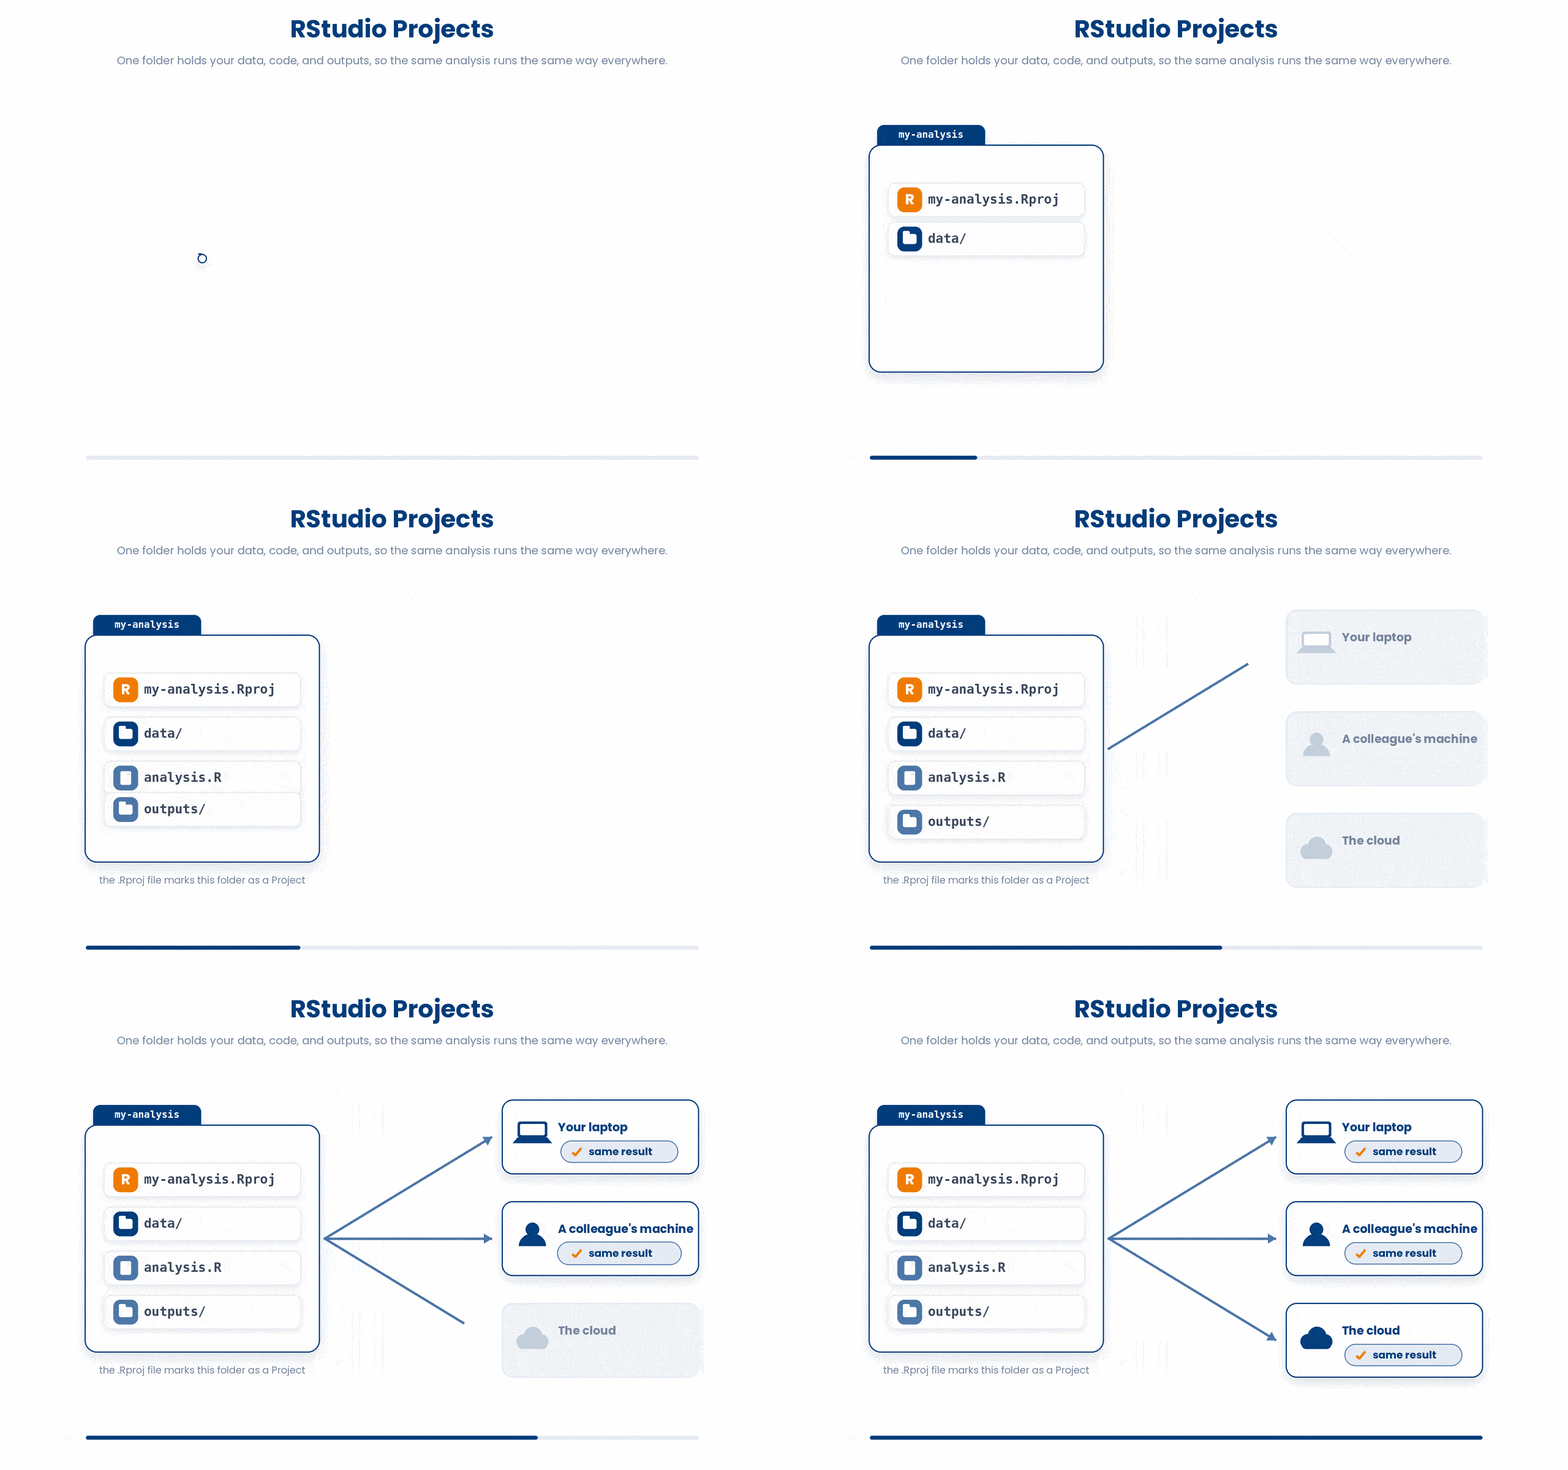
When you start a real piece of analysis on your own machine, you make an RStudio Project: a single folder that holds everything for that analysis — the data, your code, and the outputs. Working inside a Project means R always knows where your files are, so the same analysis runs the same way on your laptop, a colleague's machine, or on cloud.
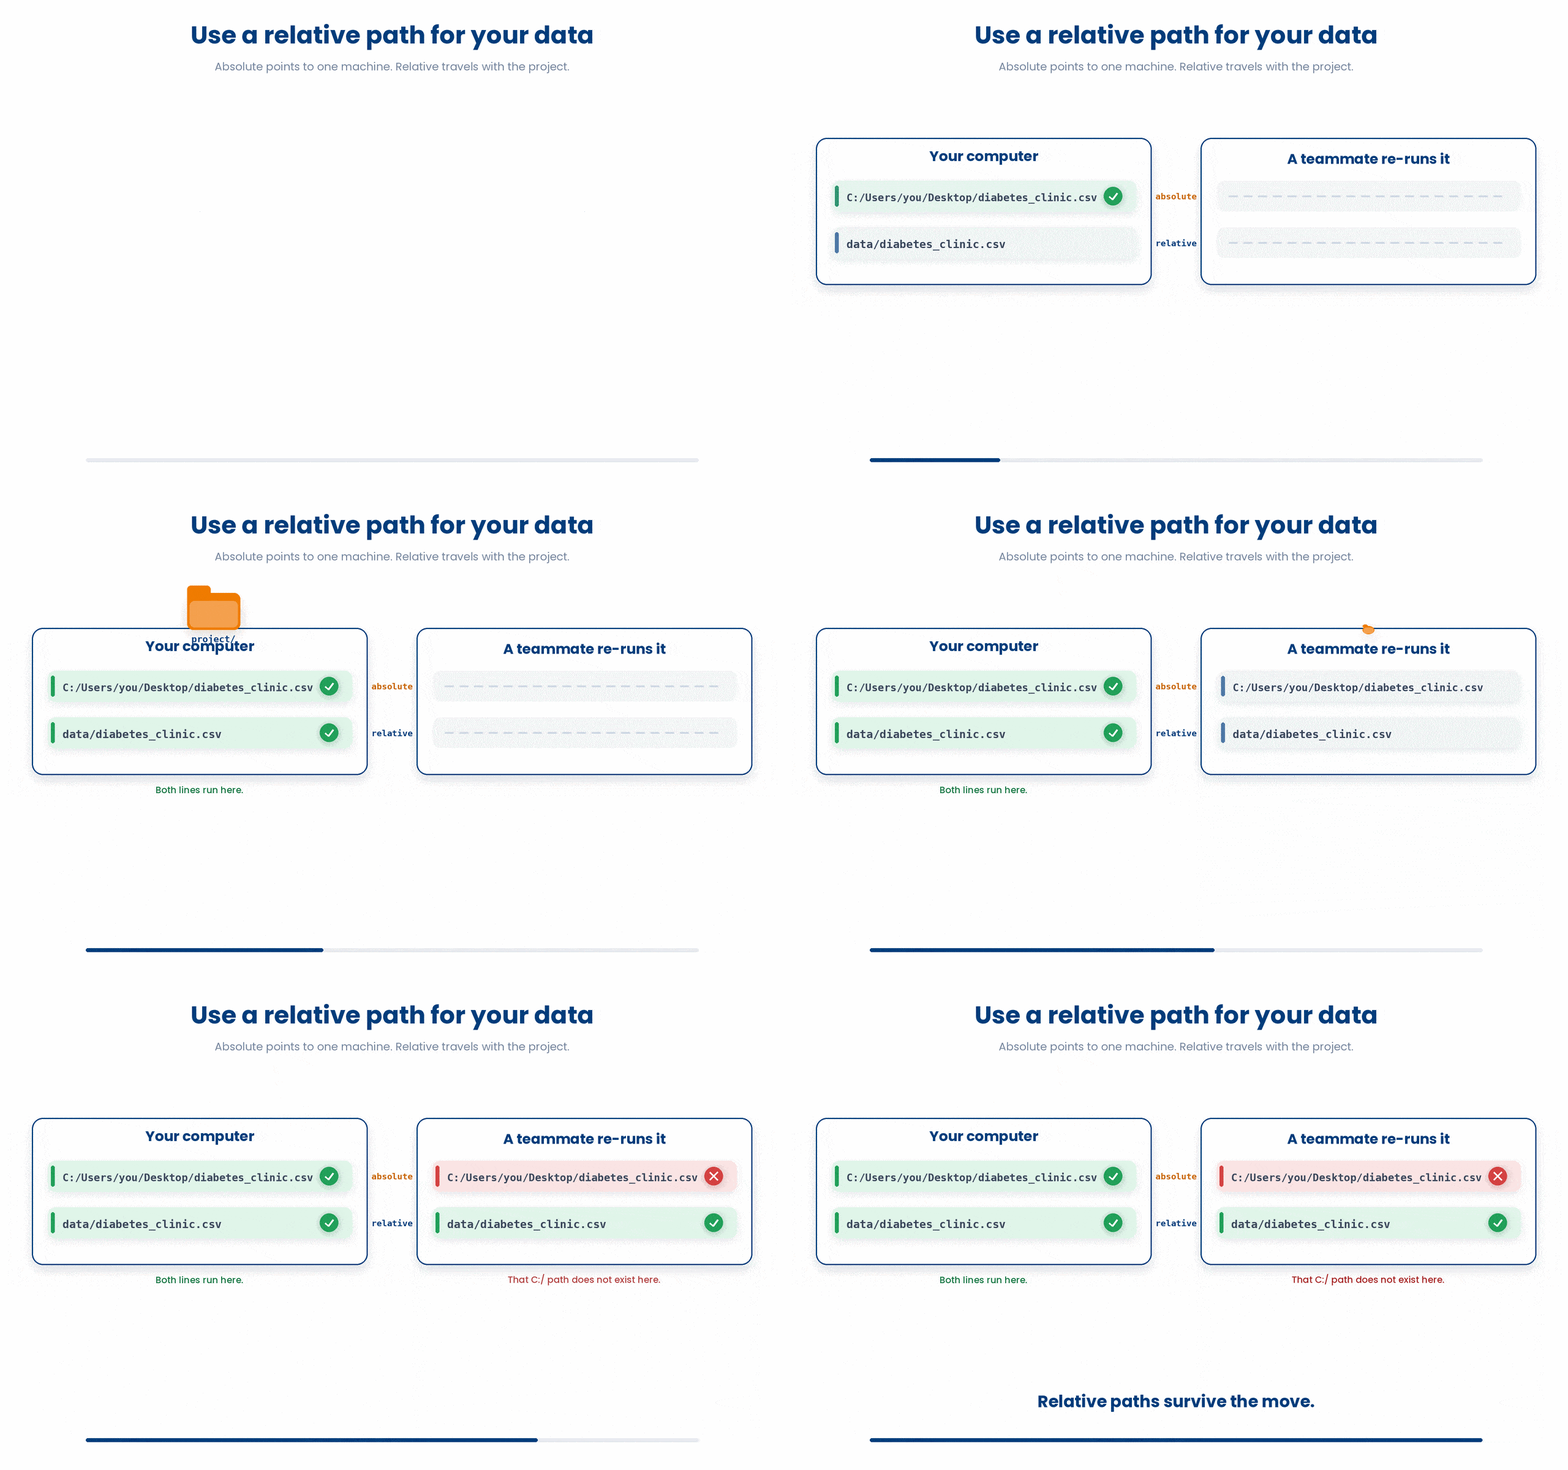
Start one habit right now: always remember to point to your data with a relative path like data/diabetes_clinic.csv, not an absolute path like C:/Users/you/Desktop/diabetes_clinic.csv. An absolute path breaks the moment the analysis runs on a different computer — and in clinical work, your analysis will be re-run by someone else.
4 Objects and the assignment arrow
An object is a name you give to a value so you can use it again later. You create one with the assignment arrow <-: the name on the left, the value on the right.
age <- 54 stores the number 54 under the name age. From then on, typing age gives you 54 back, and you can compute with it — age + 1 is 55. Good object names are short but say what they hold: age, hba1c, n_patients.
Try this snippet in the R Scratchpad on the right.
age <- 54
weight_kg <- 78.5
age
weight_kg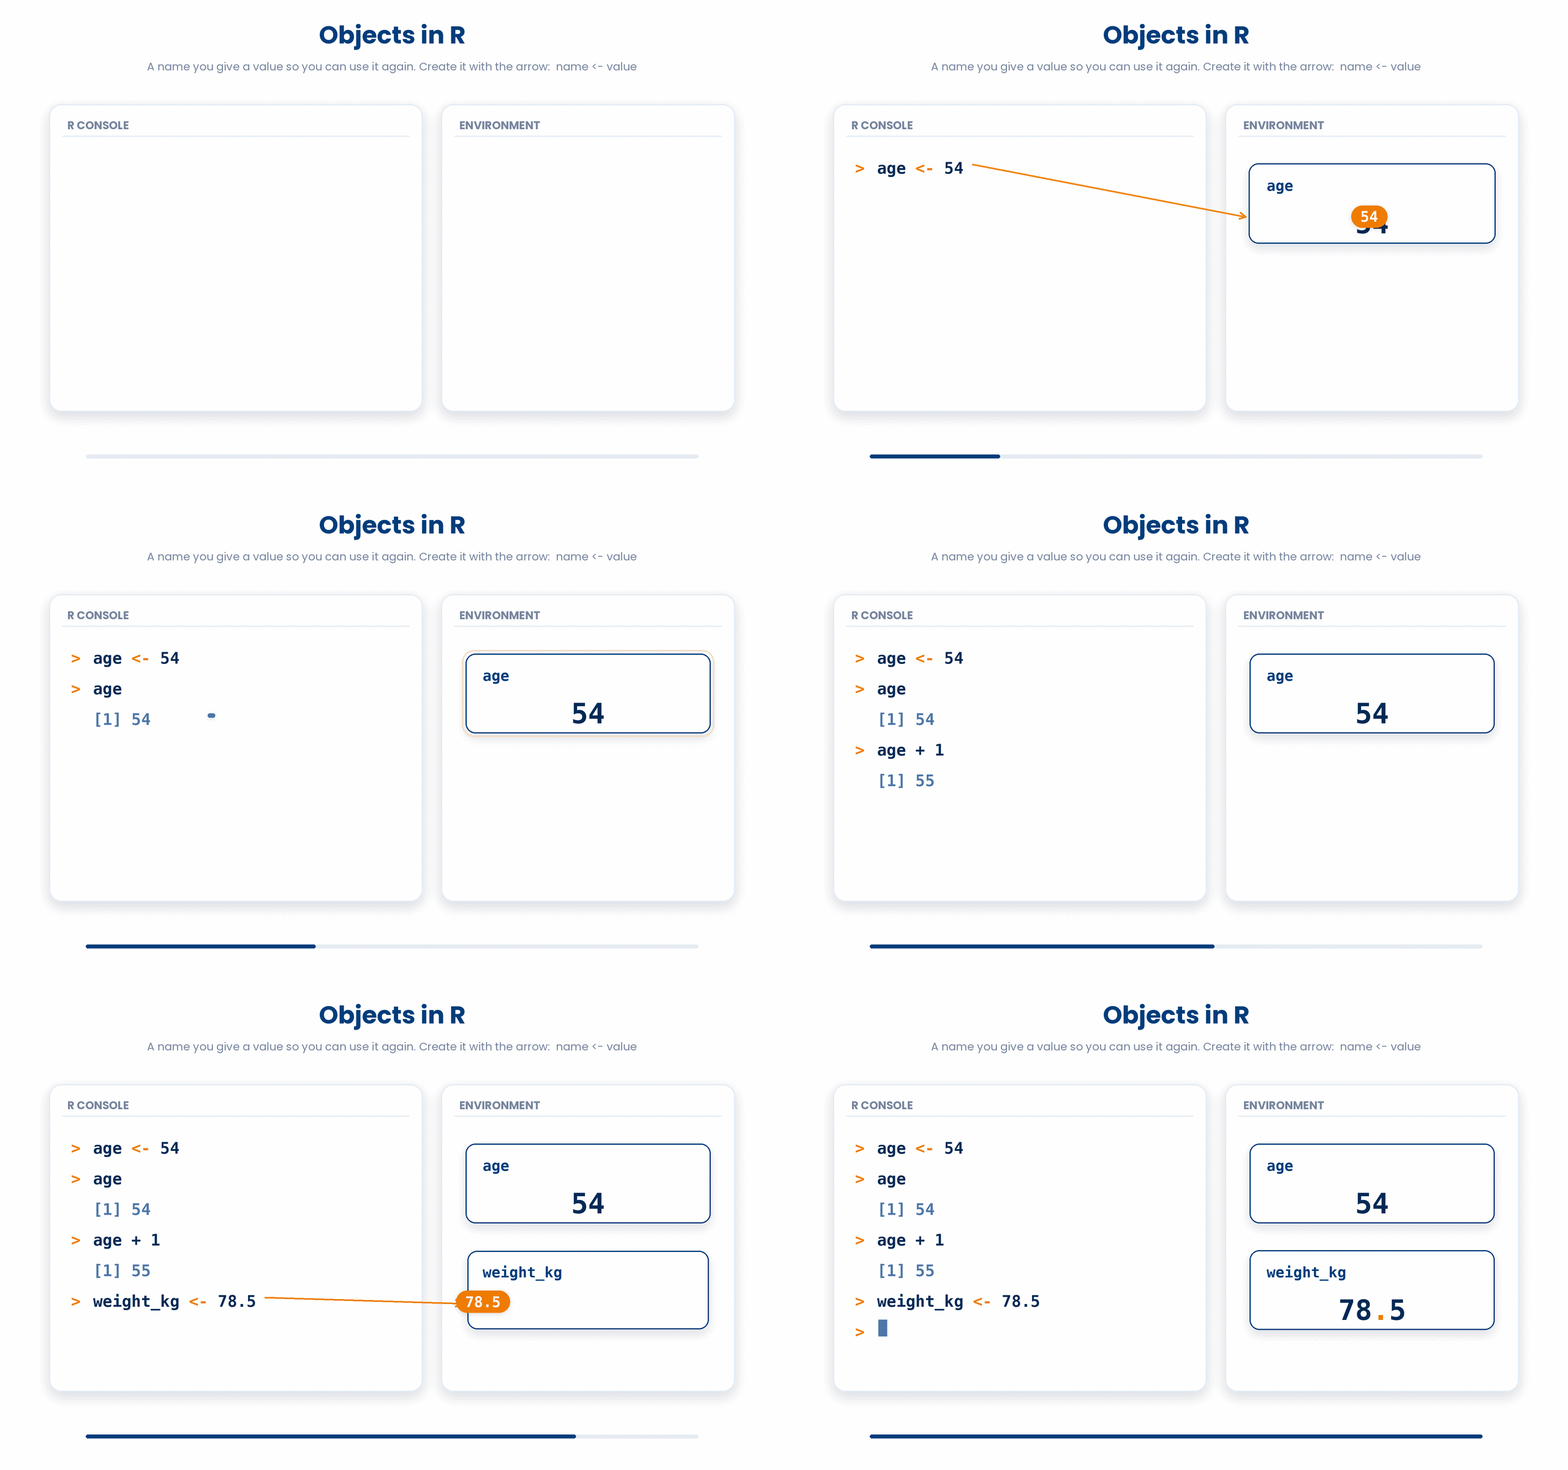
You will also see = used for assignment. Both work, but R users write <- to assign objects and keep = for setting options inside a function. Pick <- and stay consistent.
Watch the spaces around <-. x <- 5 assigns 5 to x, but x < -5 asks whether x is less than negative five — a completely different question. When in doubt, put a space on each side of <-.
5 Vectors: the workhorse of clinical data
Clinical data rarely arrives one value at a time — it arrives as a column: every patient's age, or a run of lab results. A vector is a single object that holds many values of the same type, and you build one with c() (think c for combine).
ages <- c(54, 61, 47, 73) stores four ages in one object. A column in a dataset is just a vector — which is why vectors are the foundation everything else stands on.
R works on the whole vector at once. ages + 1 adds a year to every age; mean(ages) averages all four. You never loop over patients one by one.
Try this snippet in the R Scratchpad on the right.
hba1c <- c(7.2, 8.1, 6.5, 9.4)
hba1c
mean(hba1c)
length(hba1c)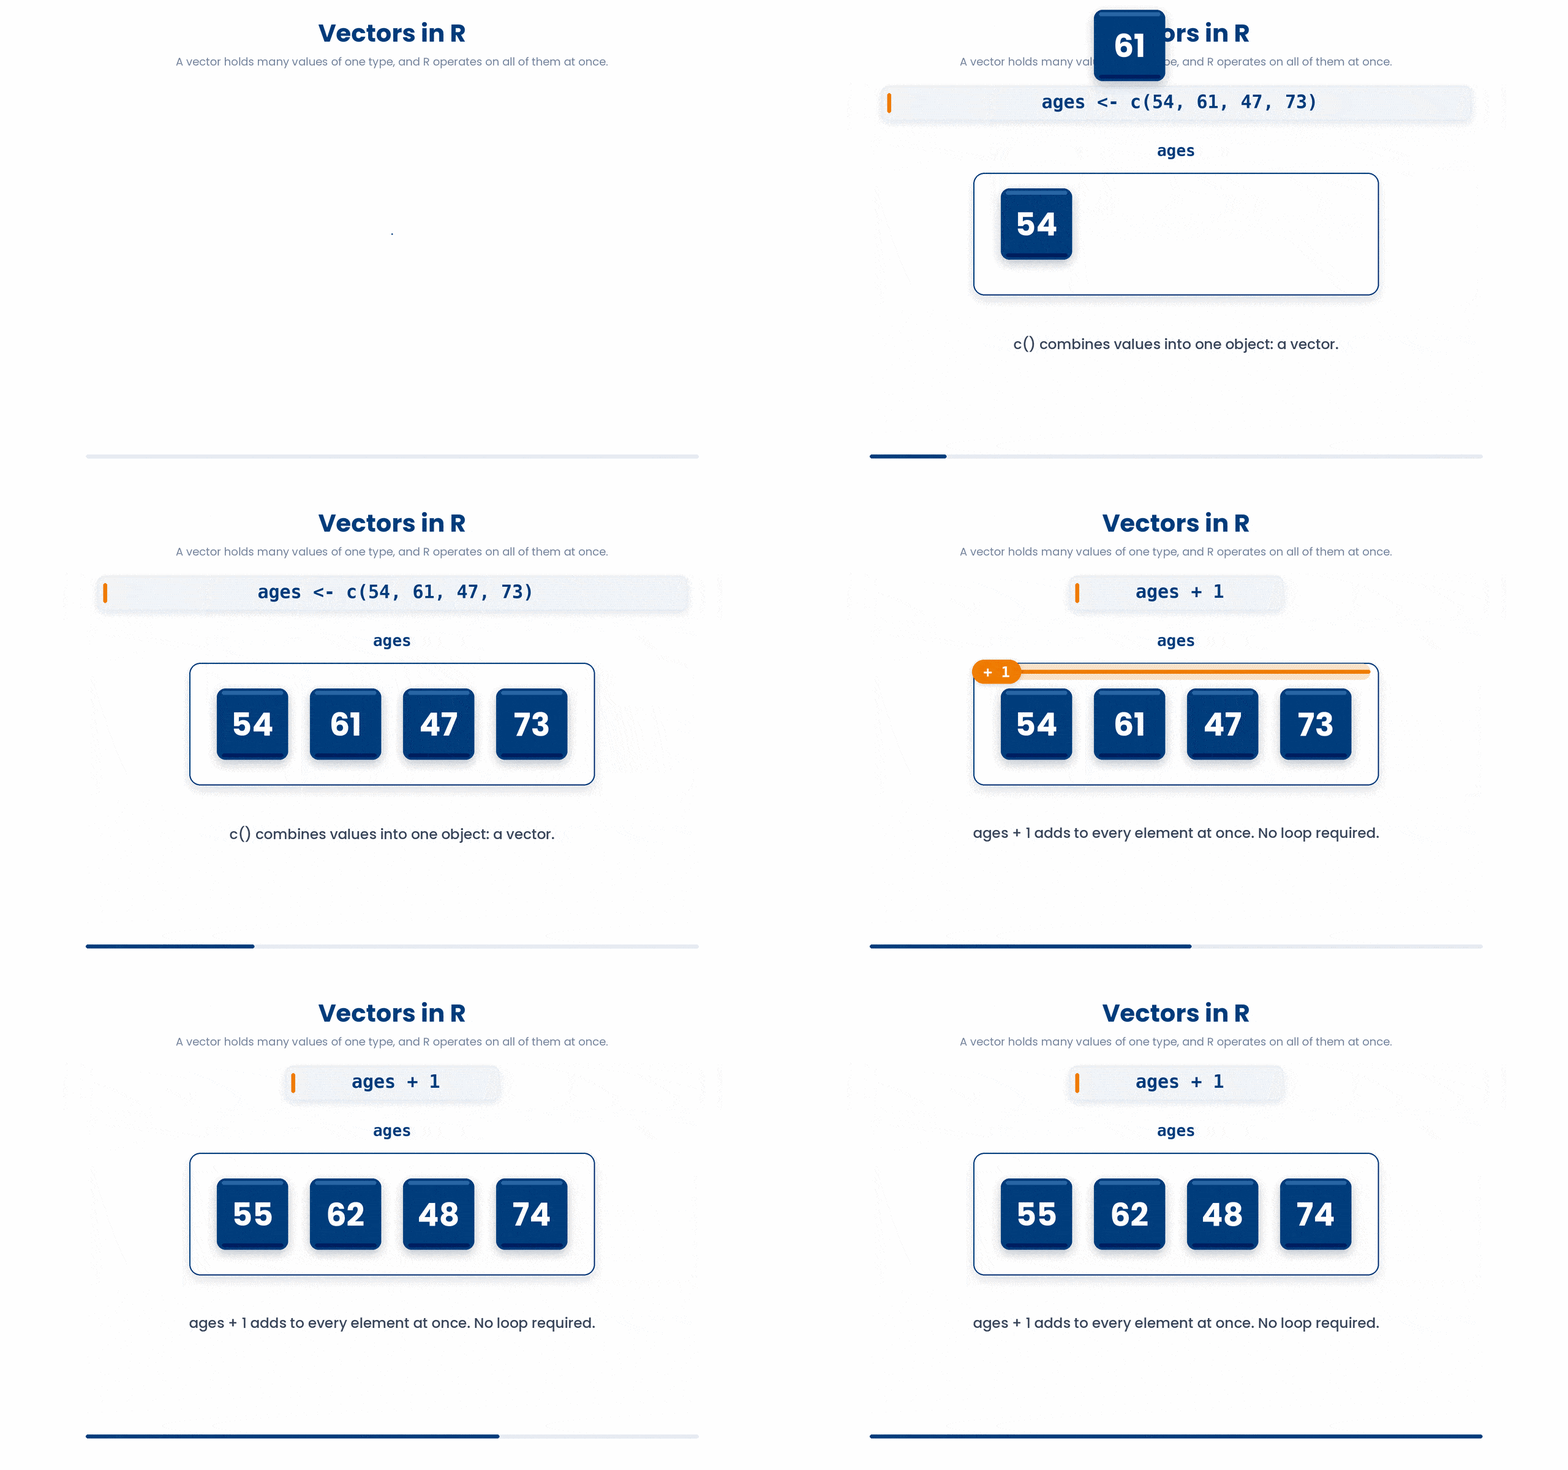
To pull out one value, use square brackets with its position: ages[1] is the first age, ages[4] the fourth.
If you have used another language such as Python, note that R counts from 1, not 0: ages[1] is the first element, not the second.
Now do the indexing yourself. Square brackets also take several positions at once — hand them a vector of positions built with c().
Try this snippet in the R Scratchpad on the right.
ages <- c(54, 61, 47, 73)
ages[1]
ages[4]
ages[c(2, 3)]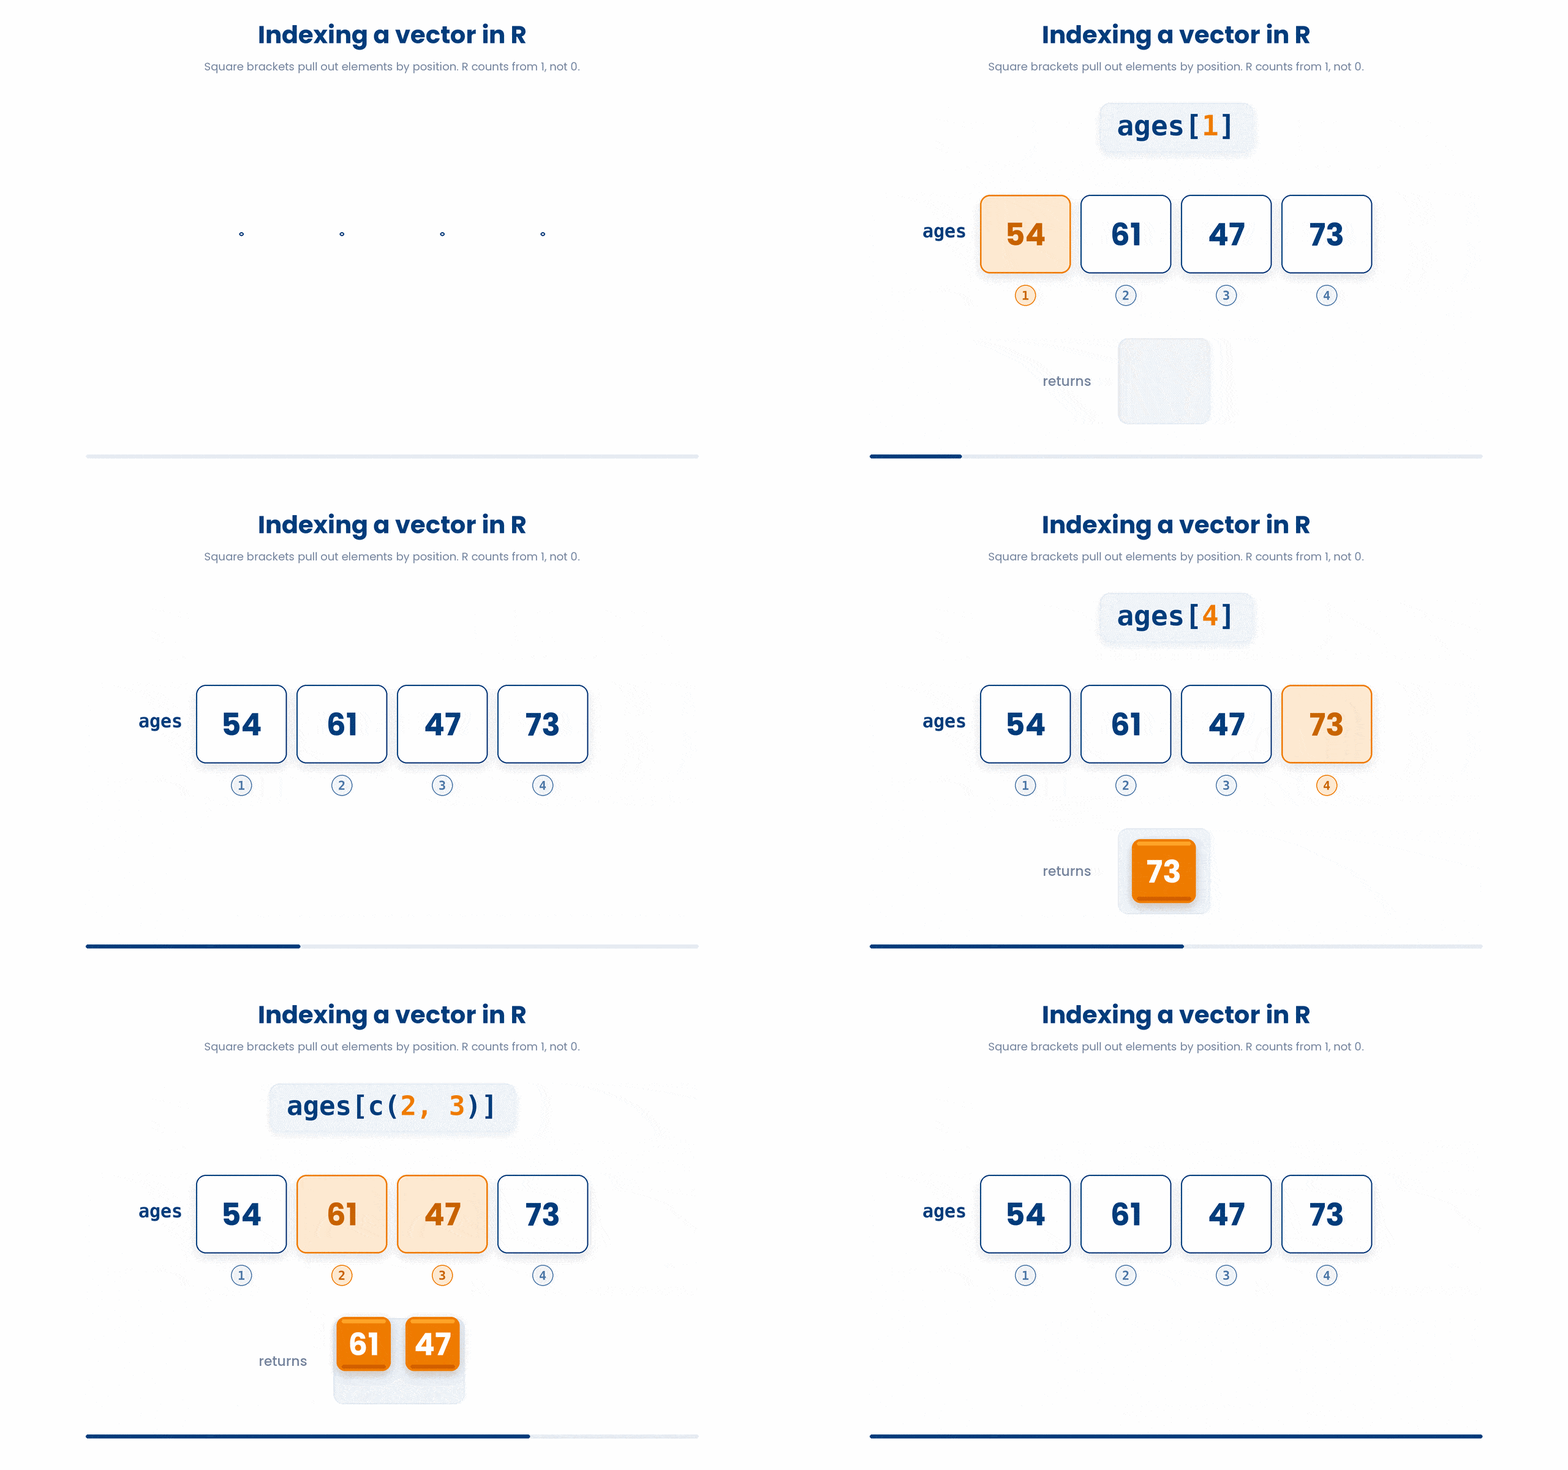
A common first slip is leaving out c() and just separating values with commas. R needs the c() to know you mean one vector of several values.
The code below is broken. Type a fixed version into the editor, then click Run & check. Success means your code runs without errors. Use Show hint only if you get stuck.
ages <- 54, 61, 47- Wrap the values in c(): ages <- c(54, 61, 47) ★
- Separate them with semicolons: ages <- 54; 61; 47
- Put them in square brackets: ages <- [54, 61, 47]
6 The four core data types
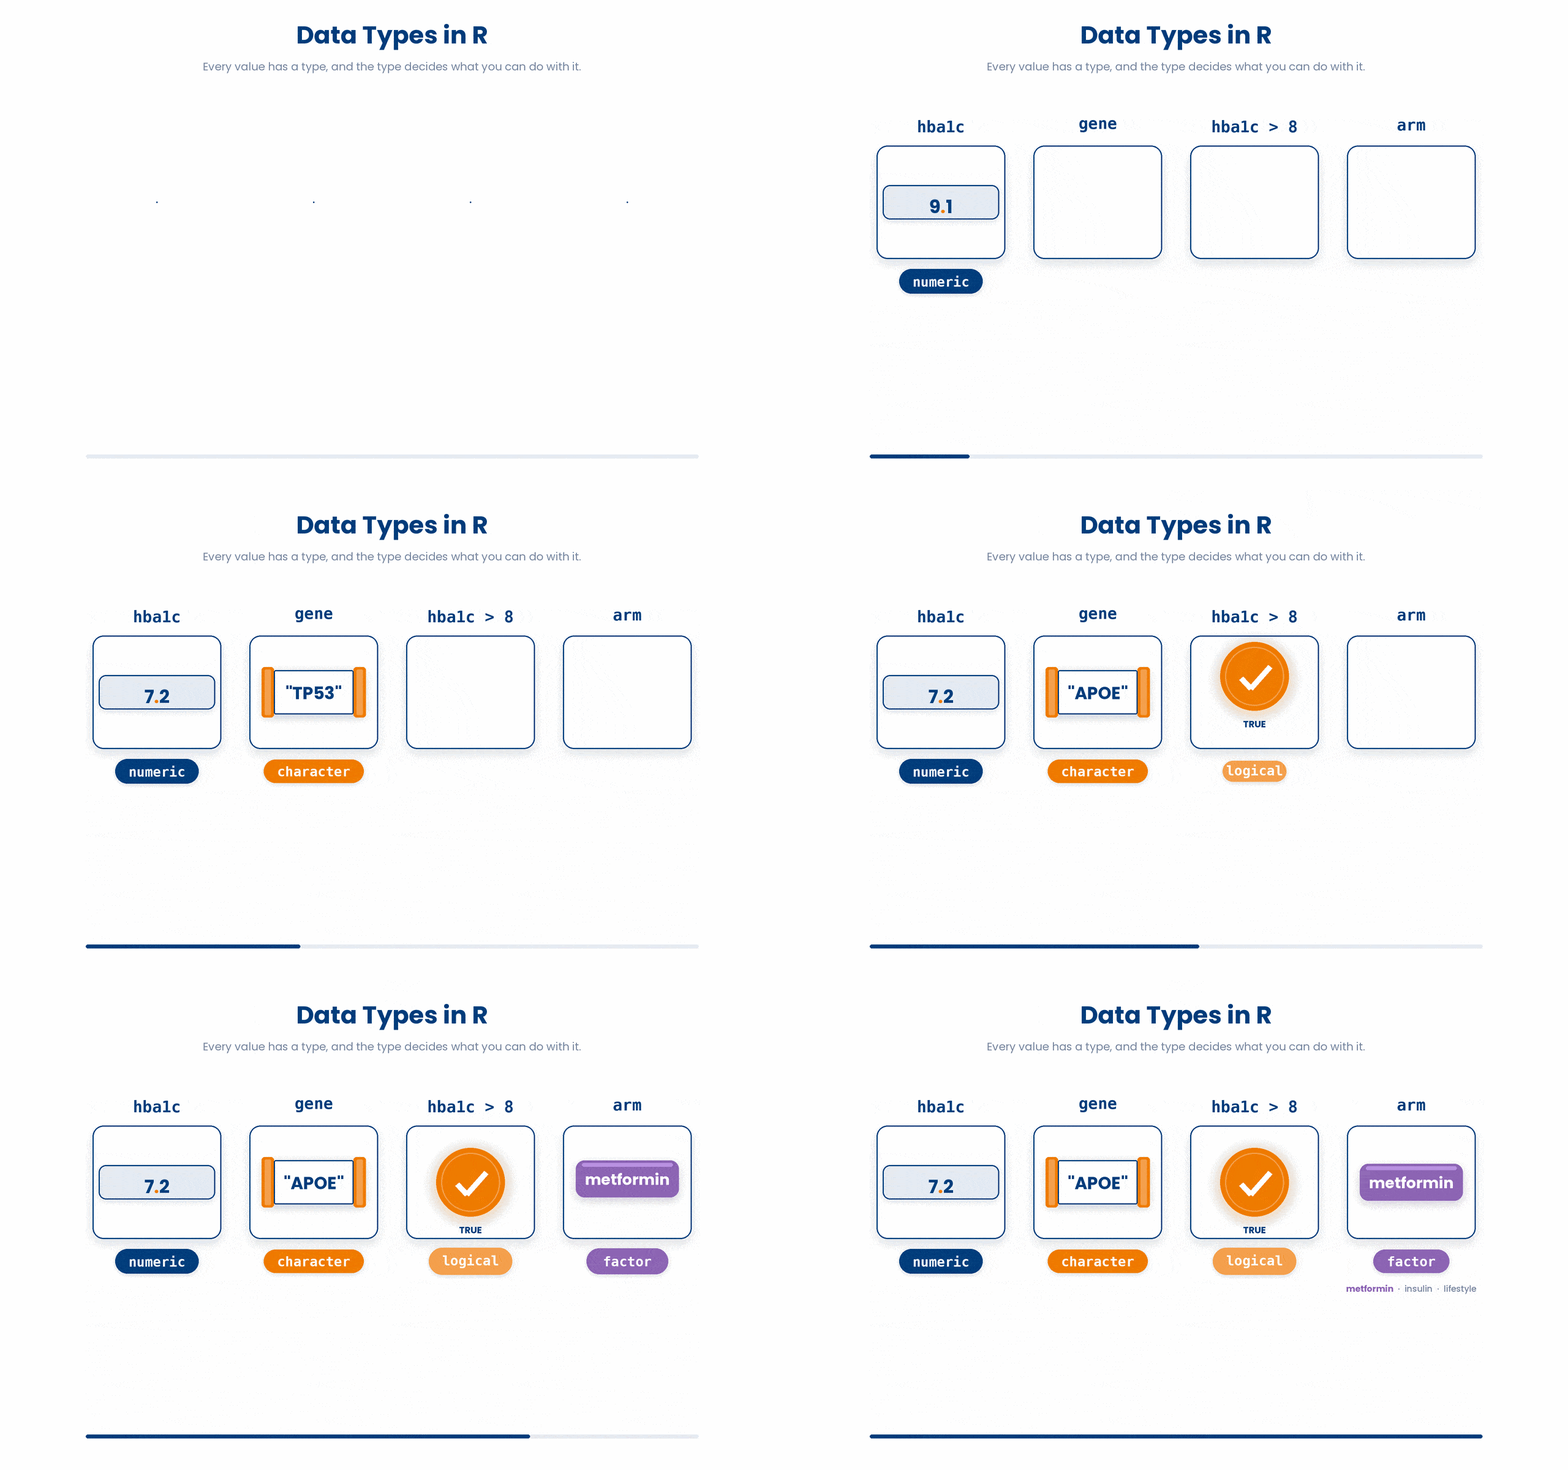
Every value in R has a type, and clinical data leans on four of them. The type matters because it decides what you can do with a variable: you can average ages, but not diagnoses.
- numeric — numbers, whole or decimal: an age of
54, an HbA1c of7.2, a p-value of4.2e-8. - character — text, always in quotes: a gene name
"APOE", a patient ID"D001", a treatment label"metformin". - logical —
TRUEorFALSE, the answer to a yes/no question:hba1c > 8isTRUEfor a result above eight. - factor — a category with a fixed set of allowed values: a treatment arm that can only be
metformin,insulin, orlifestyle; a disease stage; a sex.
You can always ask R what type a value is with class().
Logical values appear the moment you ask a question of your data. Compare a whole vector against a threshold and R answers for every element at once, handing back a logical vector you can then count with sum() — how many results are above eight?
Try this snippet in the R Scratchpad on the right.
hba1c <- c(7.2, 8.1, 6.5, 9.4)
hba1c > 8
class(hba1c > 8)
sum(hba1c > 8)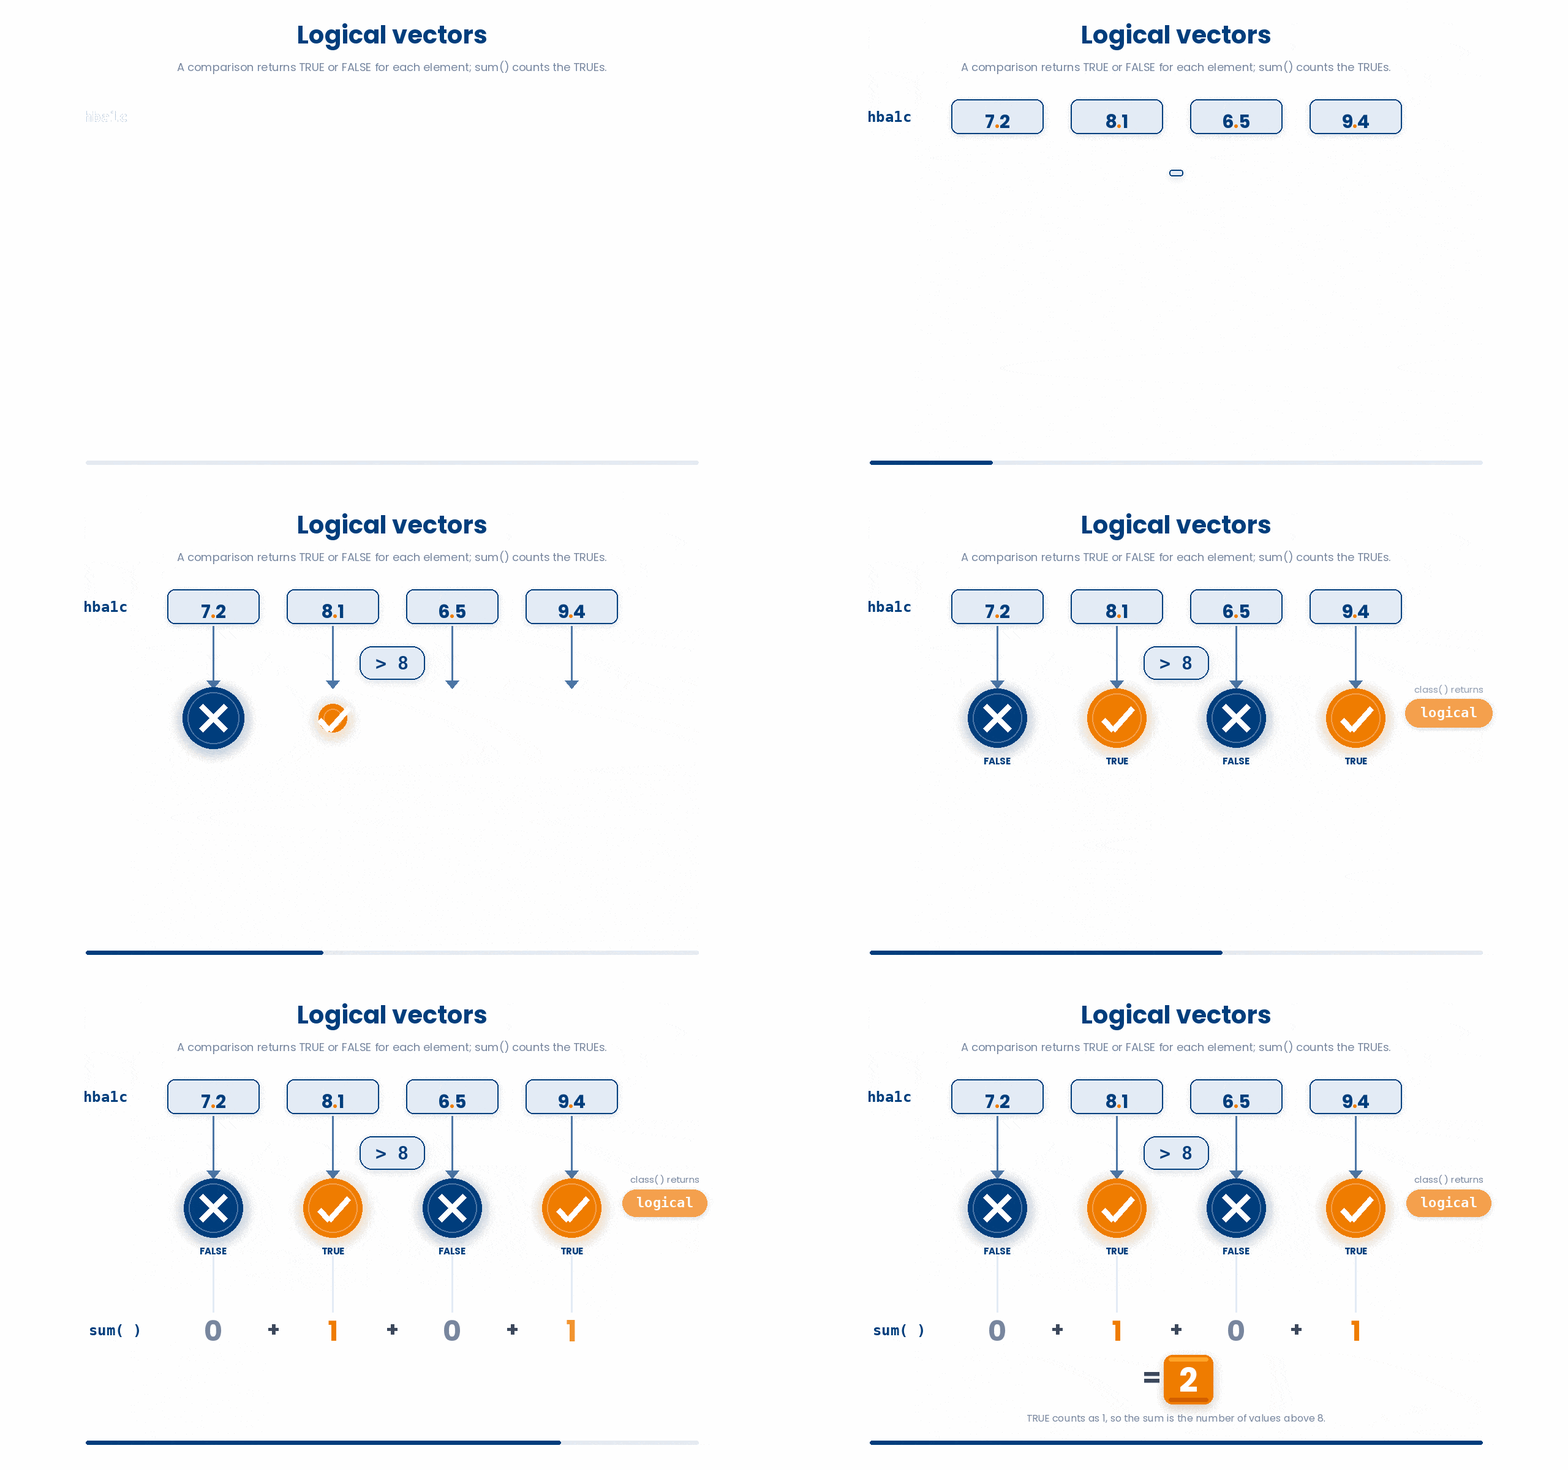
6.1 Factors: categories R can count and order
A factor is R's type for a categorical variable — one that takes a small, fixed set of values called its levels. Storing treatment as a factor, rather than plain text, lets R summarise it, count each group, and — later — use it correctly in a statistical model.
You turn text into a factor with factor(), and you see its categories with levels().
Try this snippet in the R Scratchpad on the right.
treatment <- factor(c("metformin", "insulin", "lifestyle", "metformin"))
treatment
levels(treatment)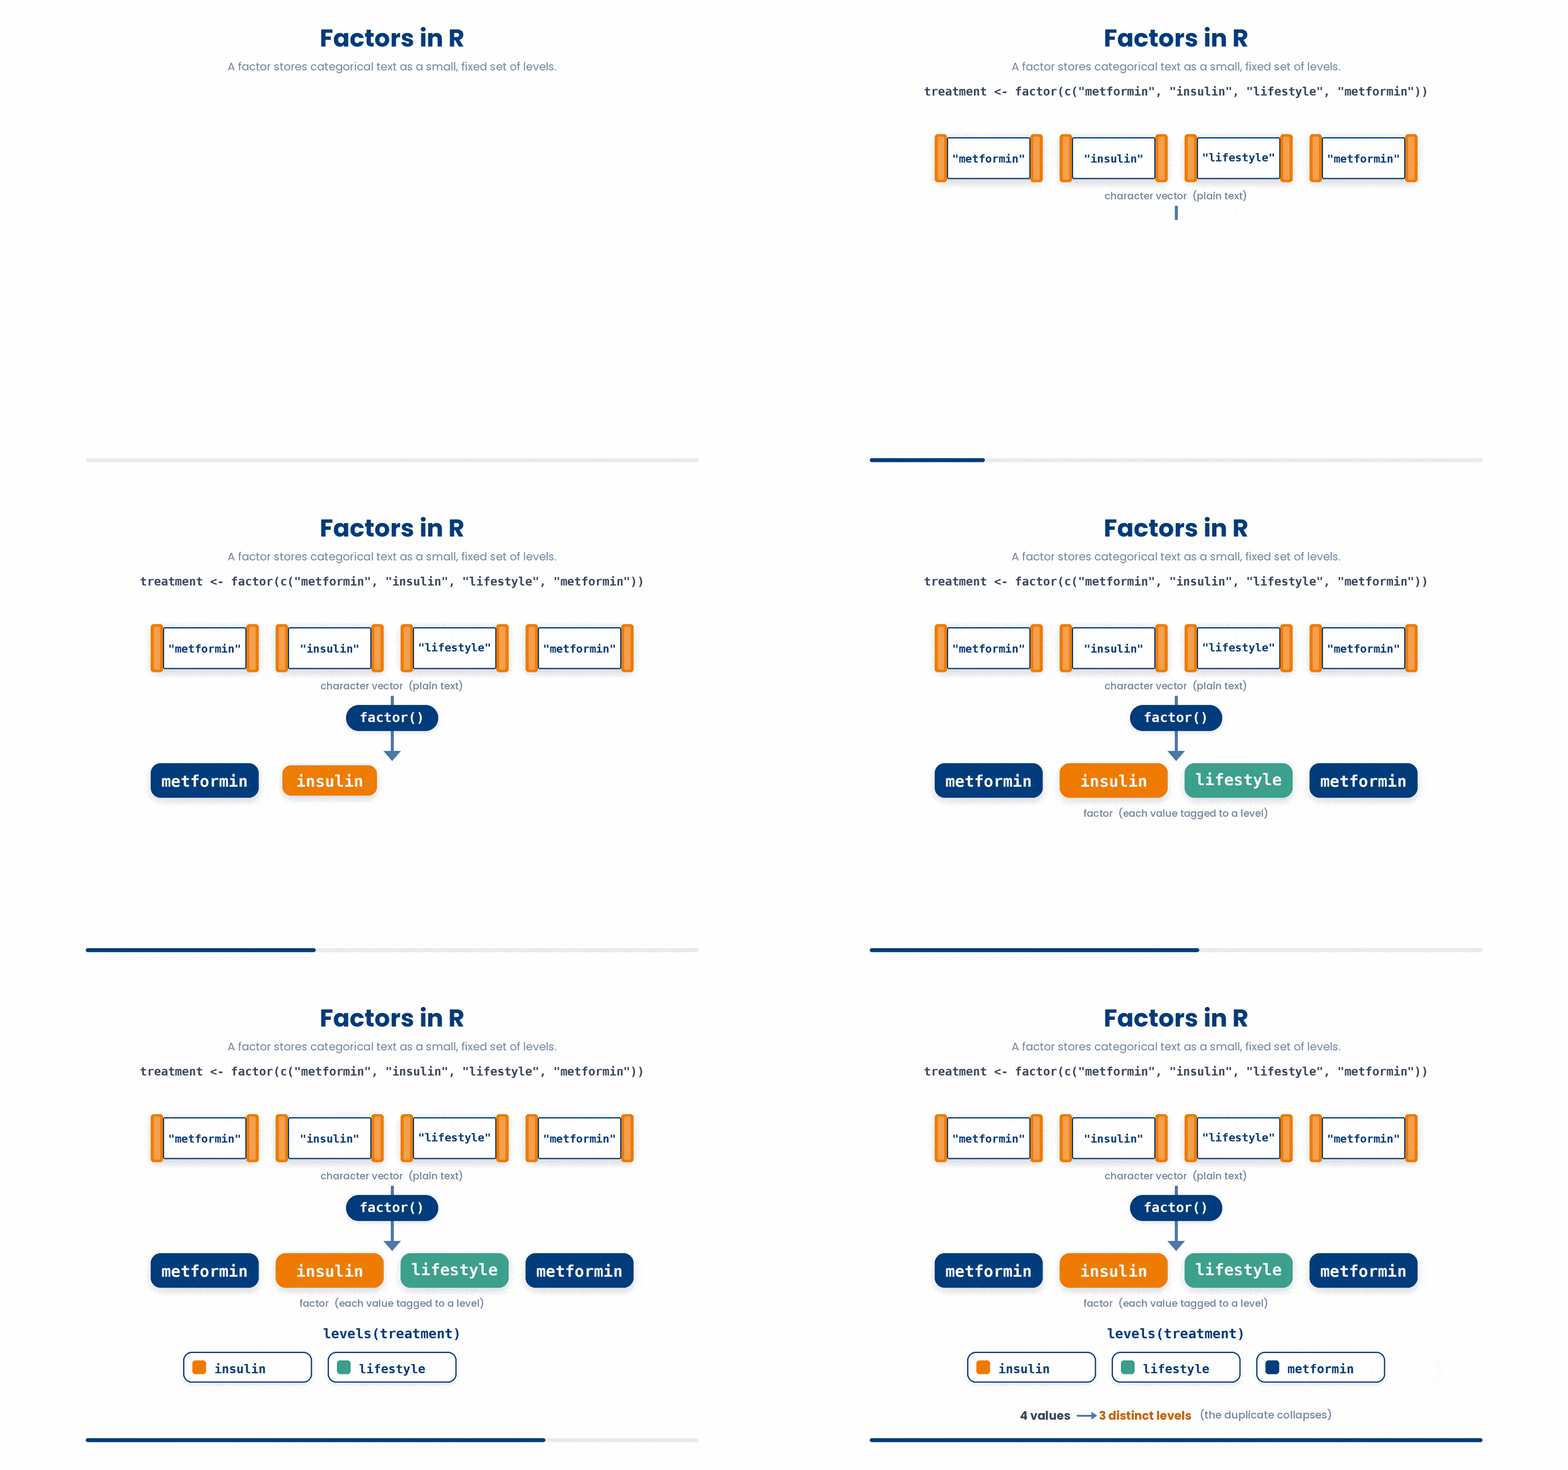
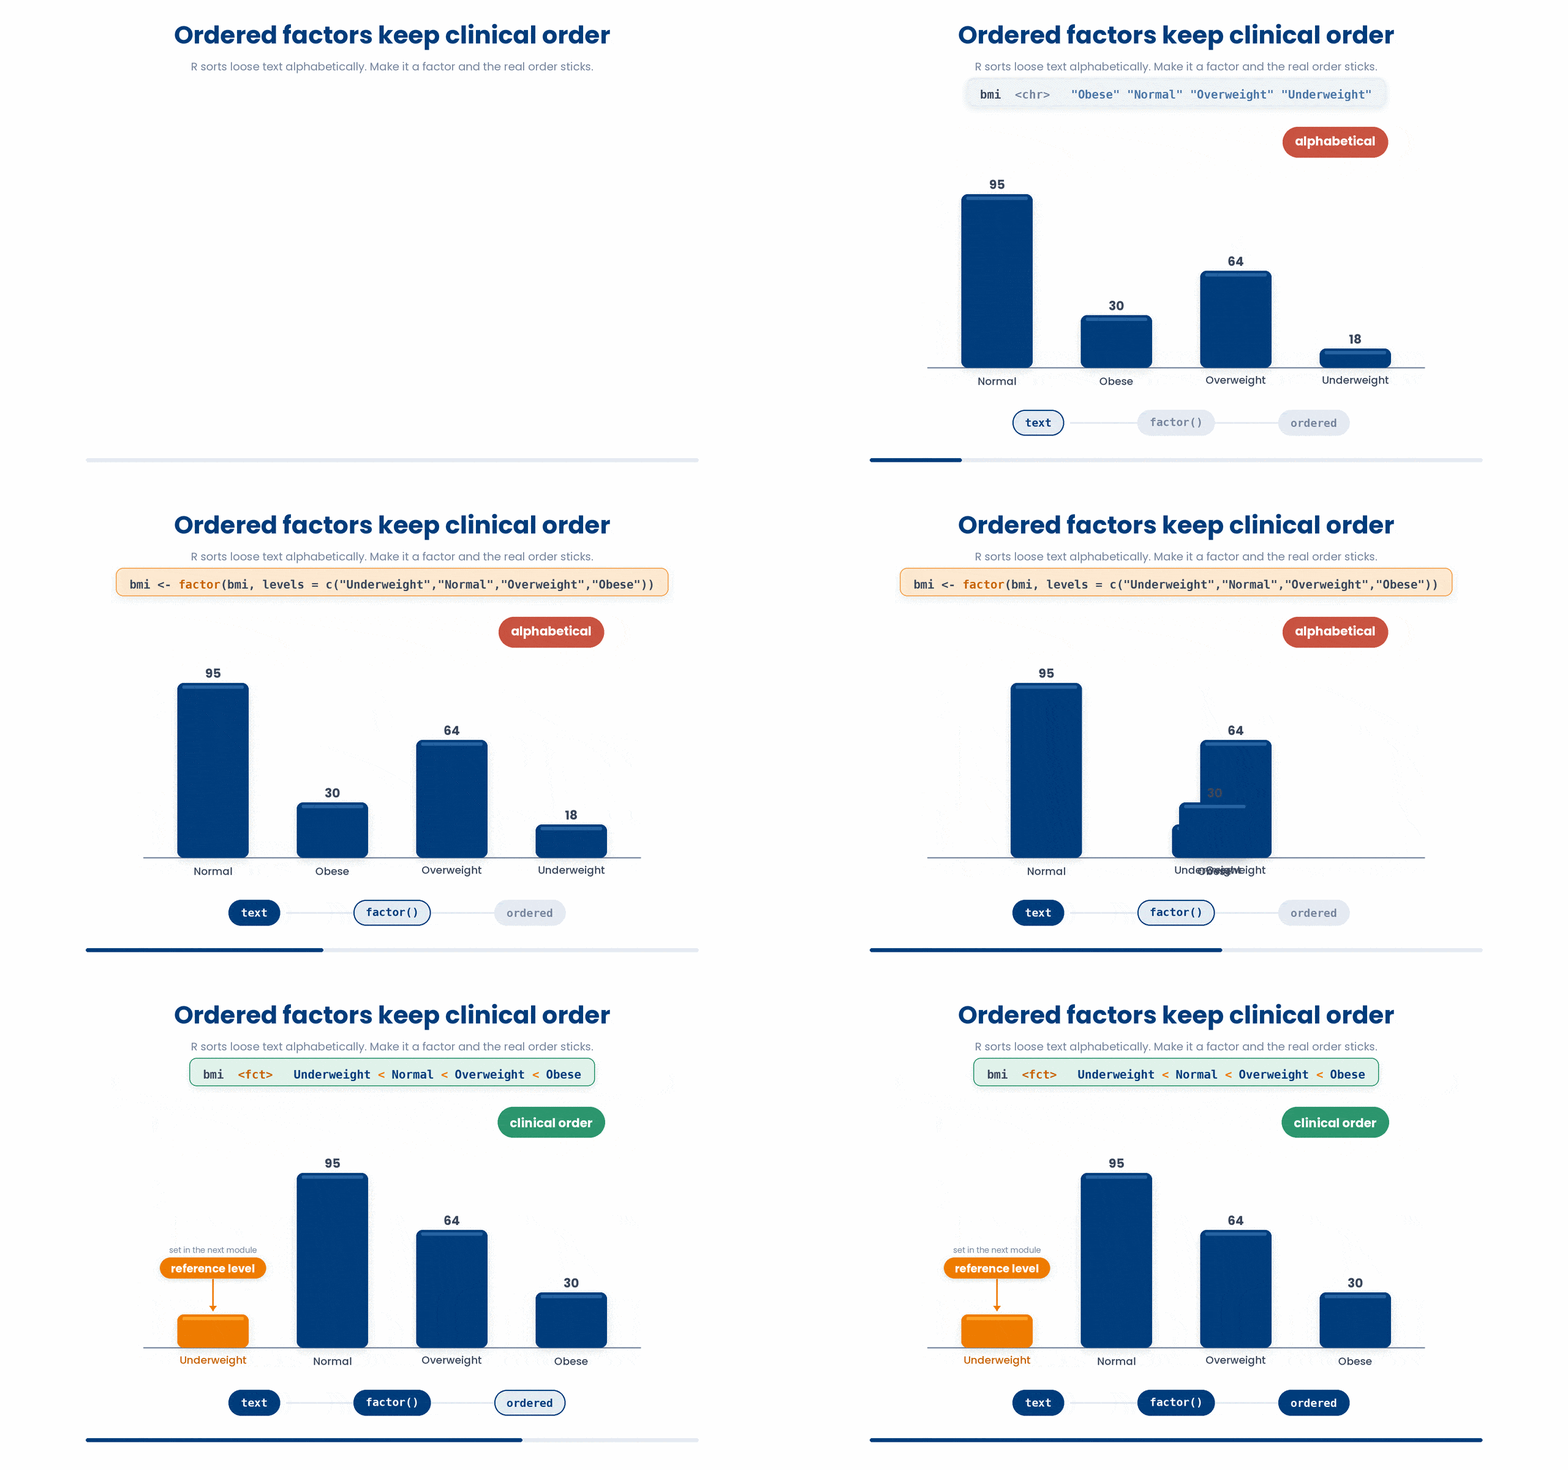
Some categories carry a meaningful order — disease stage runs I < II < III < IV. You can tell R that order, so stages tabulate and plot in clinical sequence instead of alphabetically.
A factor also carries a reference level — the category every other group is compared against in a model. You will set that deliberately in the next module; for now, just remember that a category usually belongs in a factor, not loose text.
7 Check your understanding
You have reached the end of the module. Try the same questions again — your answers here, paired with your pre-test answers, are how we measure what the module taught you. Answer every question and confidence rating, then click Submit and see results to view your score.
When you run an analysis on your own machine, why do R users work inside an RStudio Project?
Which line points to your data in a way that still works when a colleague re-runs the analysis on their own computer?
Which line stores the number 54 in an object called age?
You type x <- 5 but accidentally write x < -5 instead. What does x < -5 actually do?
You want one object holding four patient ages — 54, 61, 47, 73. Which line builds it?
You have ages <- c(54, 61, 47, 73). Which line returns the second patient's age, 61?
A variable records each patient's sex as "M" or "F", with no other values allowed. Which type best represents it in R?
For hba1c <- c(7.2, 8.1, 6.5, 9.4), what does sum(hba1c > 8) return?
I can create and name R objects with <-, and build and summarise a vector of clinical values with c().
I can pull values out of a vector by position with square brackets, remembering that R counts from 1.
I can tell whether a variable should be numeric, character, logical, or a factor, and explain when a category belongs in a factor.
8 Your results
Here is how your post-test answers compare with your pre-test answers. The pre/post pairing is the most reliable way to see what this module actually taught you.
Submit the post-test to see your results.
What is the one thing from this module that is still unclear to you?