

1 Before you start
This is not graded, and it does not count towards anything. Answer every question even if you are only guessing — having a go at something before you have been taught it is one of the best ways to remember it afterwards. The lesson ends with another short check, and there you will be shown the correct answer for anything you missed. Choose an option for every question and confidence rating, then click Submit answers.
A hypothesis test starts by writing down two competing claims. What does the null hypothesis (H0) state?
You trial a new drug to lower HbA1c against placebo. Which is a correctly framed null hypothesis?
For the same HbA1c trial, which statement is a correctly framed alternative hypothesis (H1)?
In a two-sample t-test, what does the t-statistic measure?
Where does the p-value come from once you have a test statistic?
A trial reports p = 0.03. Which interpretation is correct?
A small pilot trial returns p = 0.30. What can you conclude?
With 10,000 patients, a mean HbA1c difference of 0.02% reaches p < 0.001. What does this illustrate about the p-value?
I can state a null and alternative hypothesis for a clinical question and explain what a test assumes about H0.
I can explain what a test statistic and p-value represent and run a two-sample comparison with t.test().
I can explain in plain words what a p-value does and does not mean, and reject the classic misreadings on sight.
2 Introduction
In Module 5 you built a confidence interval — a range that quantifies how uncertain an estimate is. A hypothesis test asks a different, sharper question: is there a difference at all, yes or no? The interval measures uncertainty; the test forces a decision. This first part shows you the reasoning behind that decision — how a clinical question becomes two competing claims, how R boils your data down to a single number, and how to read the p-value that comes out without falling for the misreadings that trip up almost everyone.
This part of the module covers two foundations, the first feeding directly into the second:
- The logic of a test — stating a null and an alternative in clinical words, then seeing how a test statistic and its p-value fall out of your data.
- Reading a p-value — what it actually measures, and the three misreadings you must learn to reject on sight.
By the end of this part you will be able to state a null and alternative hypothesis for a clinical question, explain what a test statistic and p-value represent, run a two-sample comparison with t.test(), and say in plain words what a p-value does — and, just as importantly, what it does not — mean.
Try every snippet in the R Scratchpad on the right. This part needs no data file — you will build small trials by hand with c() and let base R run the test. Use the native pipe |> if you reach for a pipe, and call library() explicitly for every package.
3 The logic of a hypothesis test
A test starts by writing down two competing claims about the world, then asks which one the data favour. You always frame them in clinical terms first, and only then reach for R.
The null hypothesis — written H0 — is the claim of no effect: no difference between groups, no change after treatment, no association. The alternative hypothesis — written H1 — is what you suspect instead: that a real difference exists. A test assumes H0 is true, then checks how surprising your data would be under that assumption.
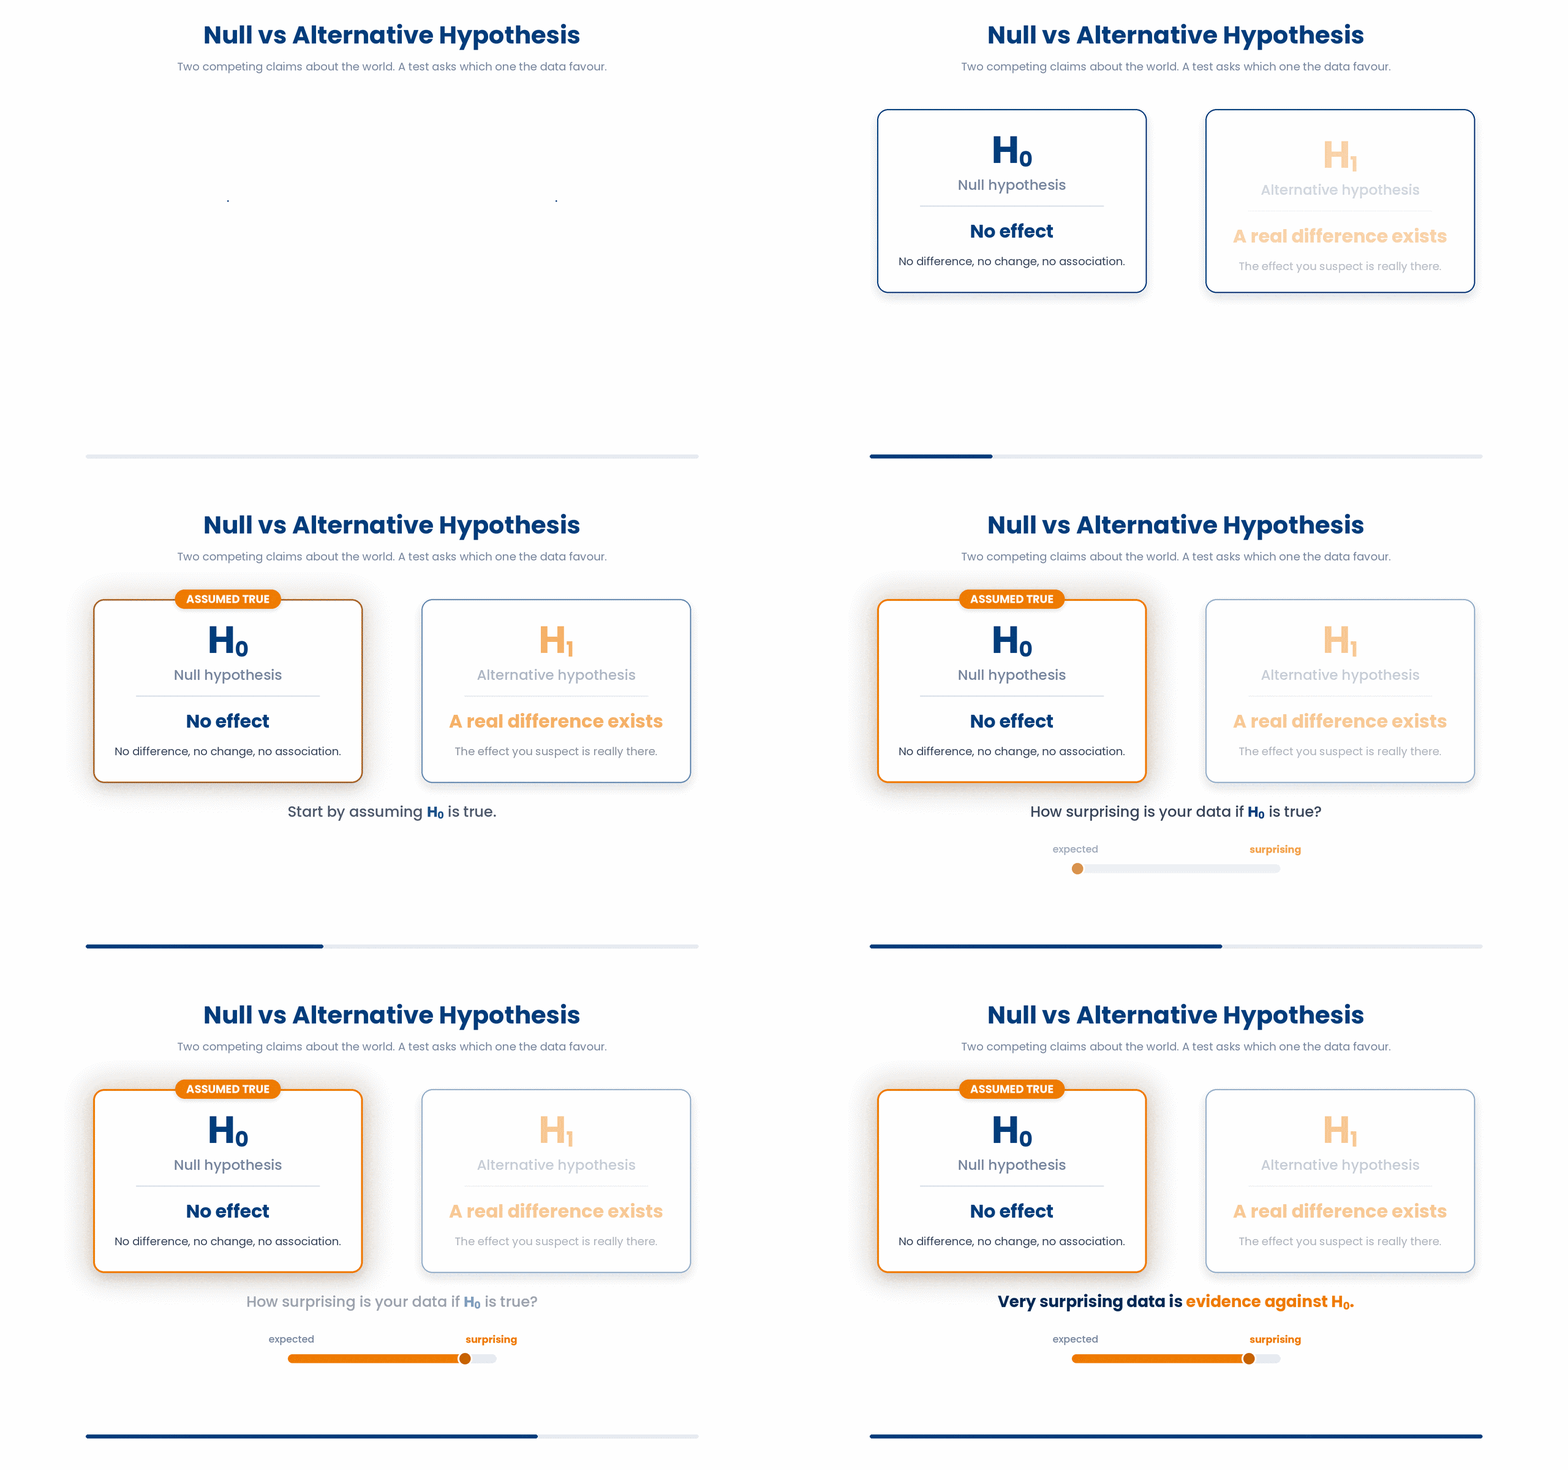
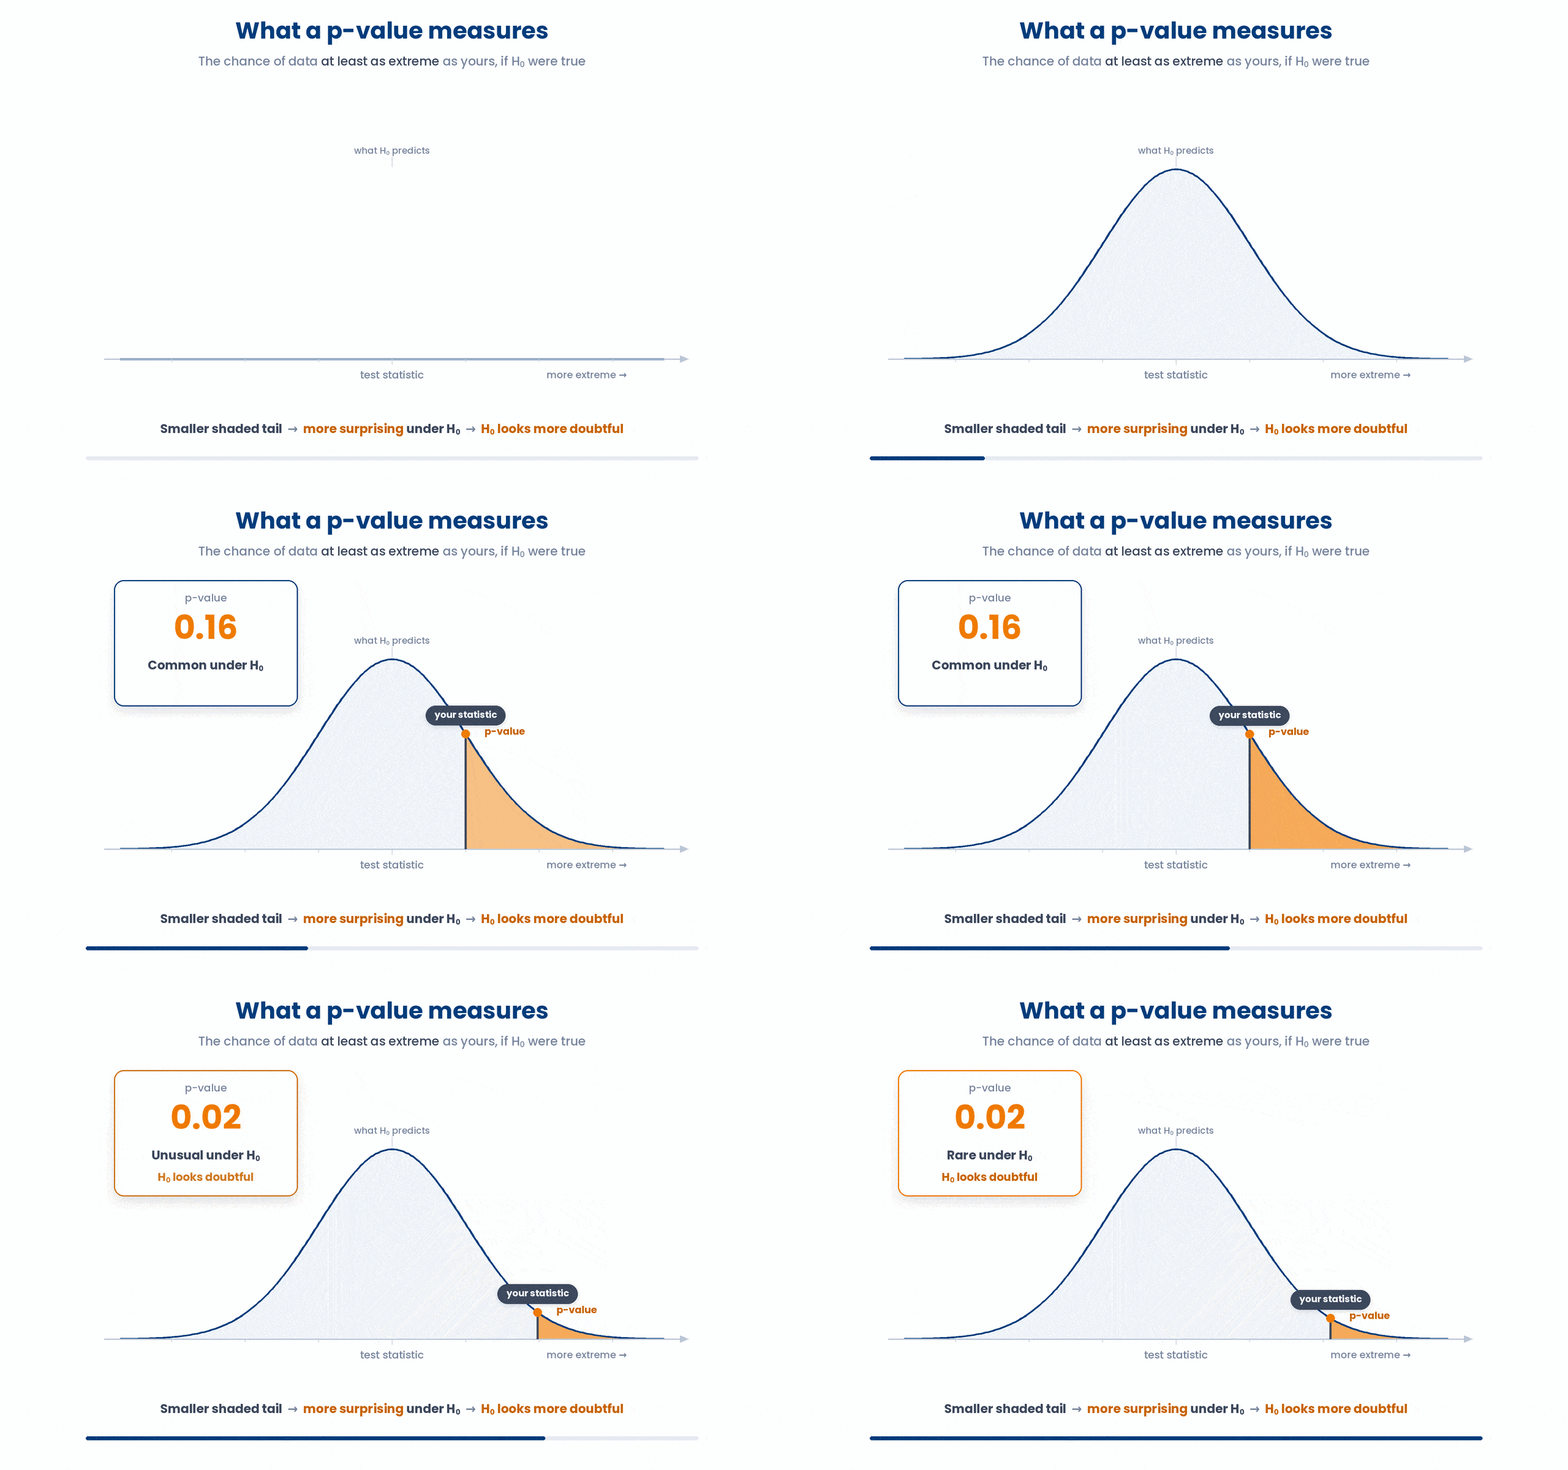
Let’s make it a bit more concrete. You trial a new drug to lower HbA1c. H0 says the drug and placebo produce the same mean HbA1c. H1 says the means differ. The test asks: if the drug truly did nothing, how often would chance alone hand me a difference as large as the one I saw?
To answer that, the test boils your data down to a single number called a test statistic — for comparing two means, a t-statistic. It measures how far apart the groups are, scaled by their variability. A big test statistic means the groups are far apart relative to the noise.
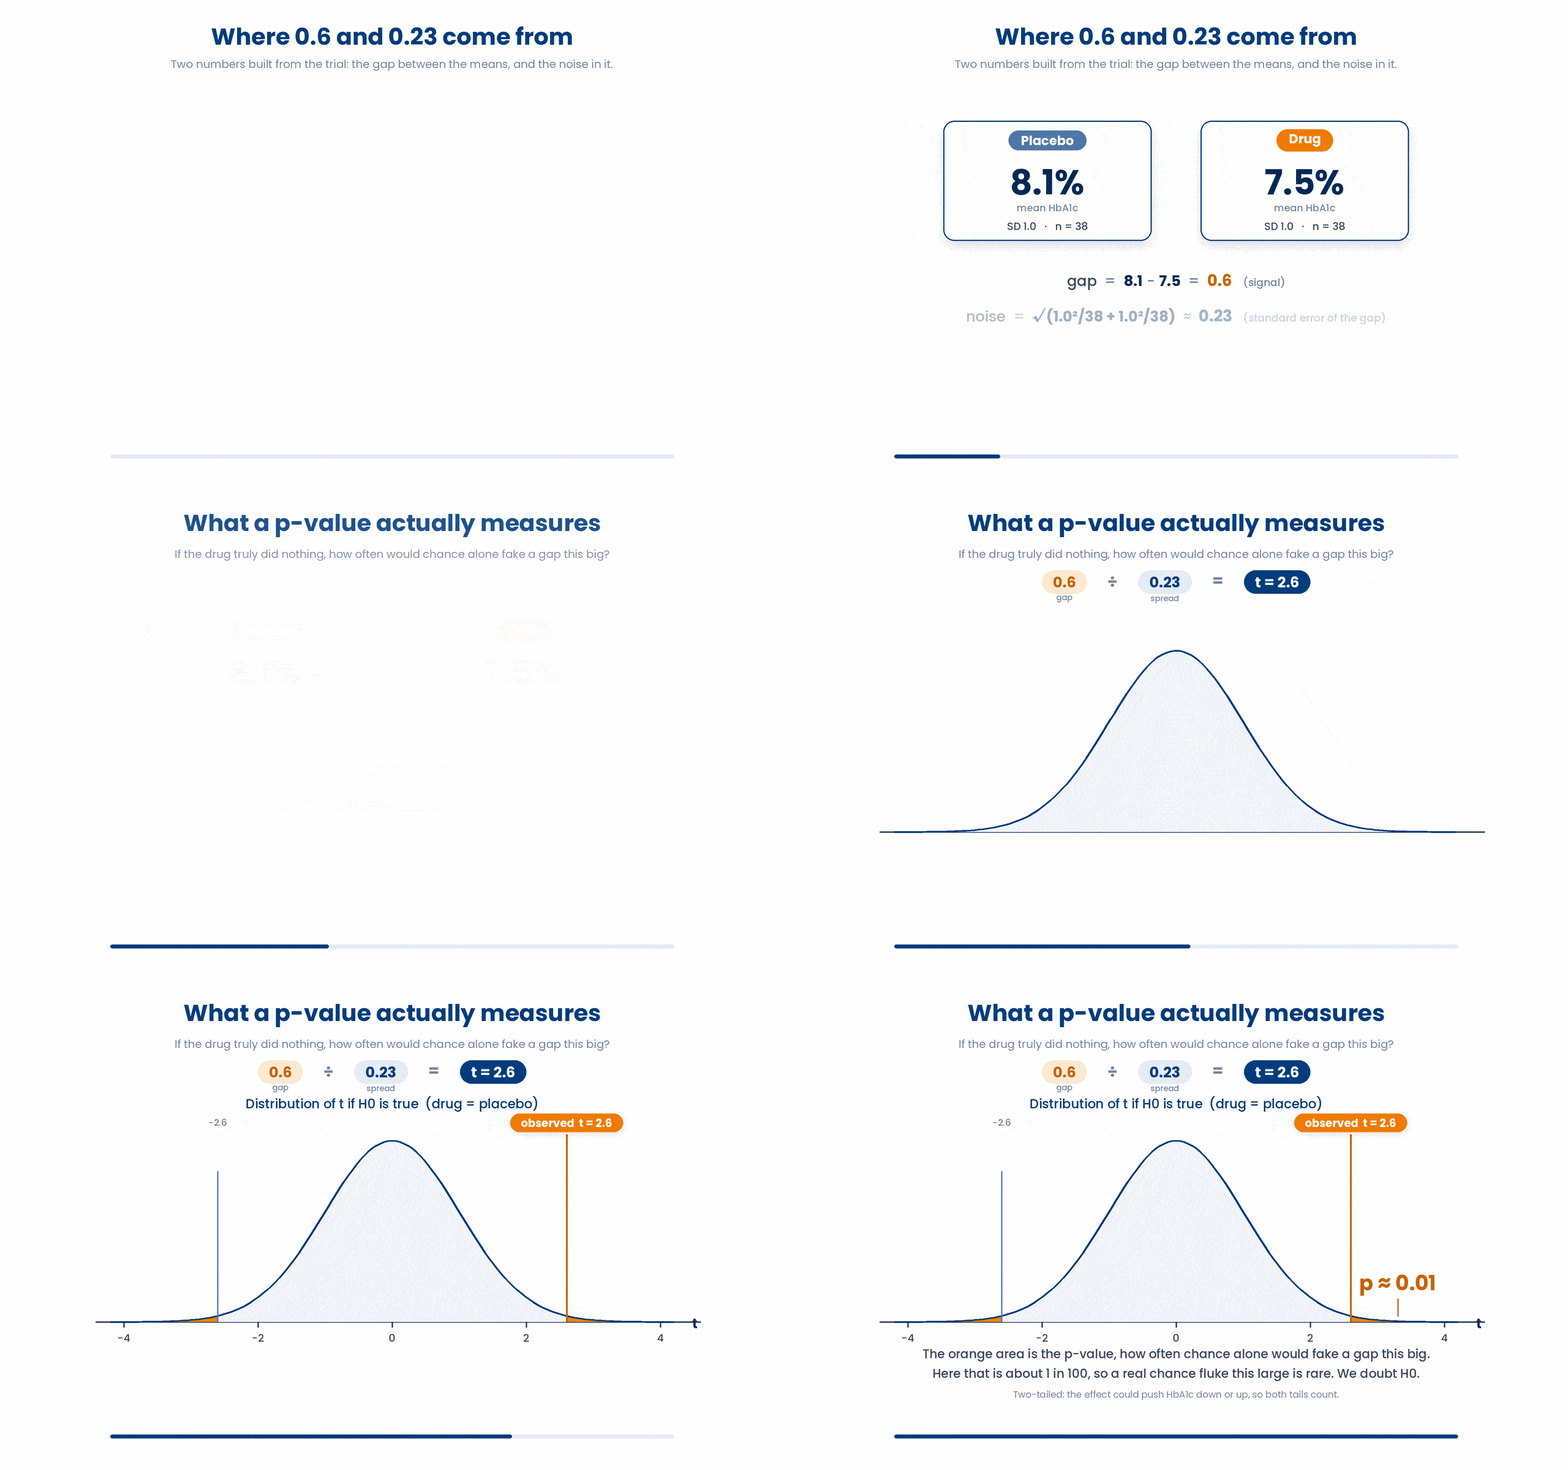
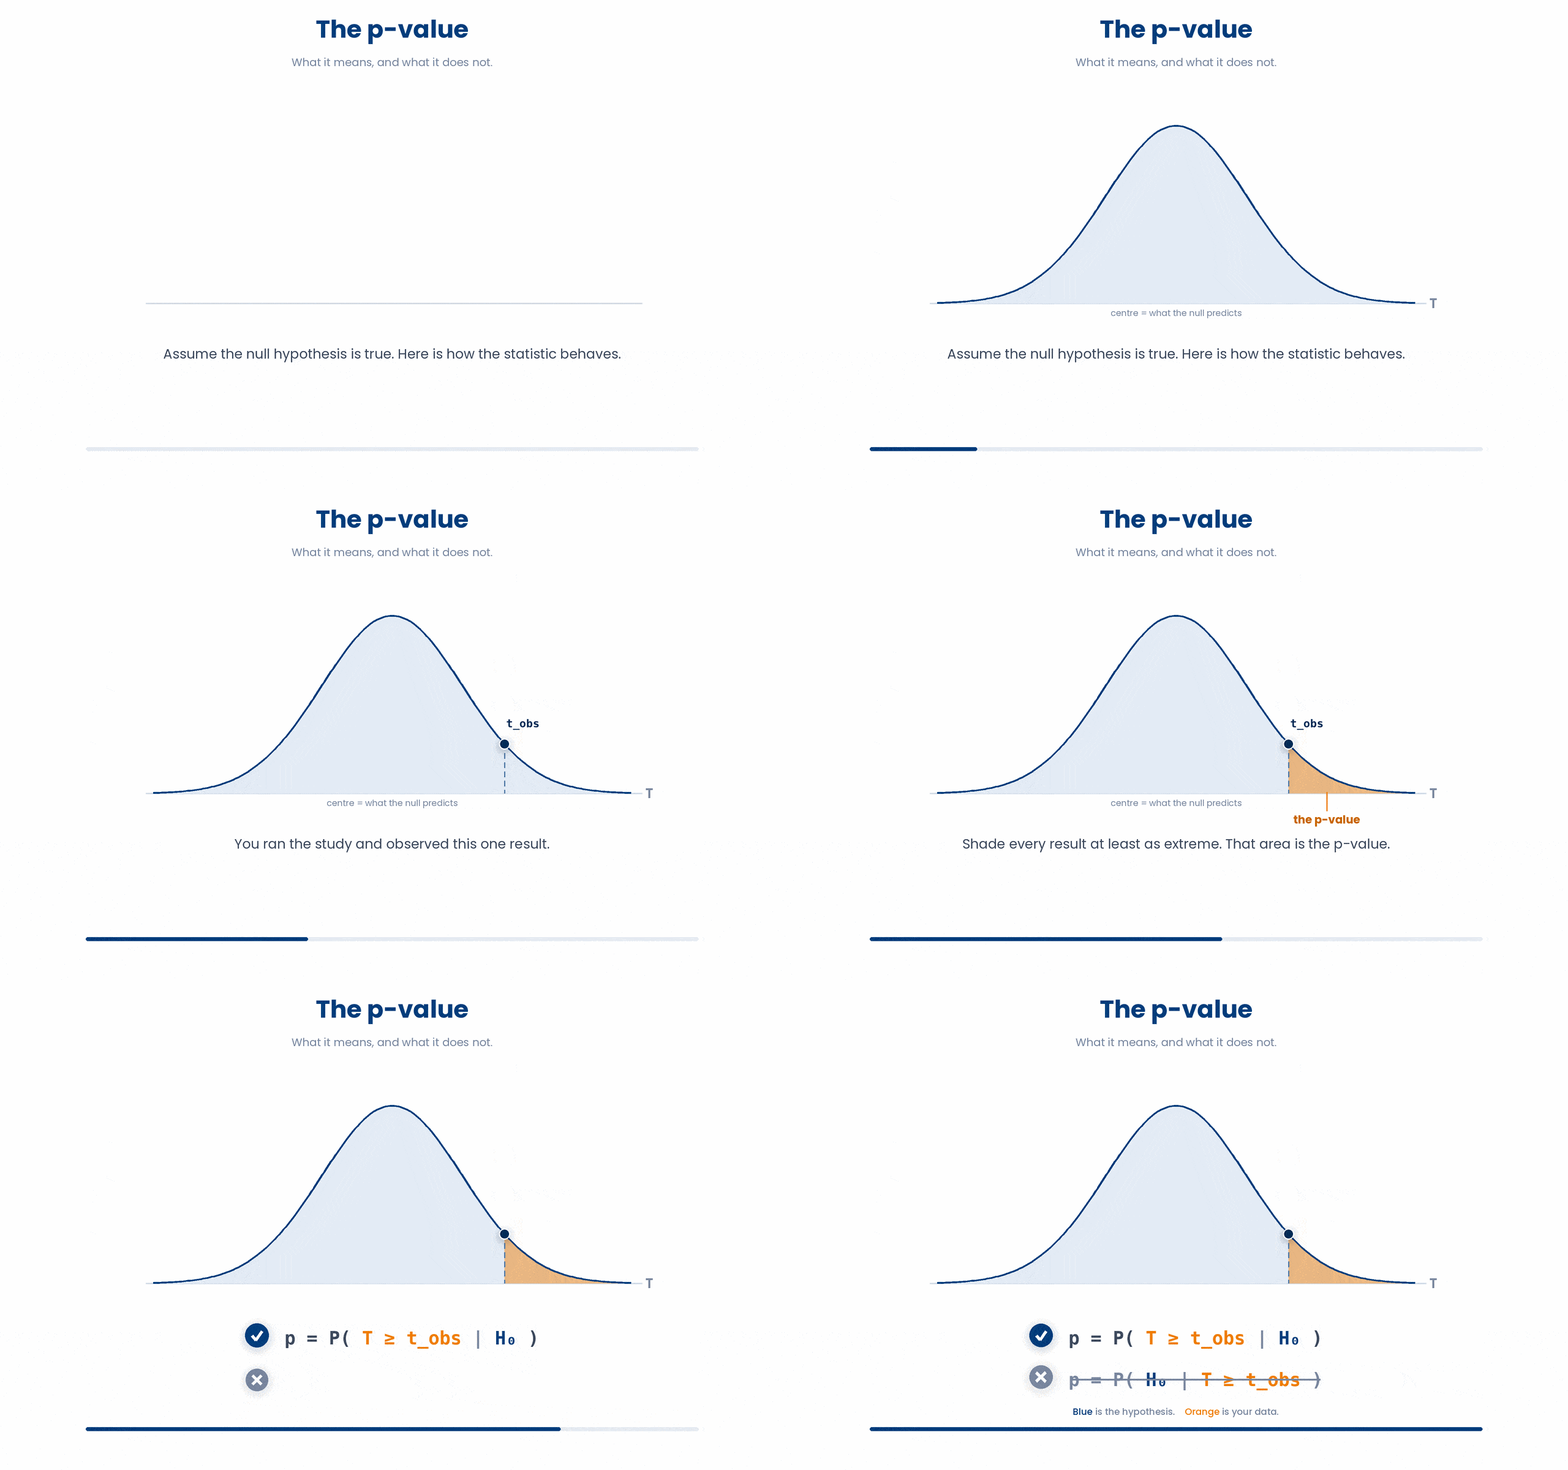
The p-value is the area in the tail of the null distribution beyond your statistic, so the further out your data lands, the smaller that area and the more it strains the null hypothesis.
That statistic is then converted into a p-value: the probability of seeing data at least as extreme as yours IF the null were true. A small p-value means your data would be surprising under H0, so H0 looks doubtful. We unpack exactly what the p-value does and does not say in the next section.
You can run the whole machine in one line. t.test() takes two vectors of values and reports the t-statistic, the degrees of freedom, the p-value, and a confidence interval for the difference.
Try this snippet in the R Scratchpad on the right.
drug <- c(6.8, 7.1, 6.5, 7.4, 6.9)
placebo <- c(7.6, 8.0, 7.4, 7.9, 8.2)
t.test(drug, placebo)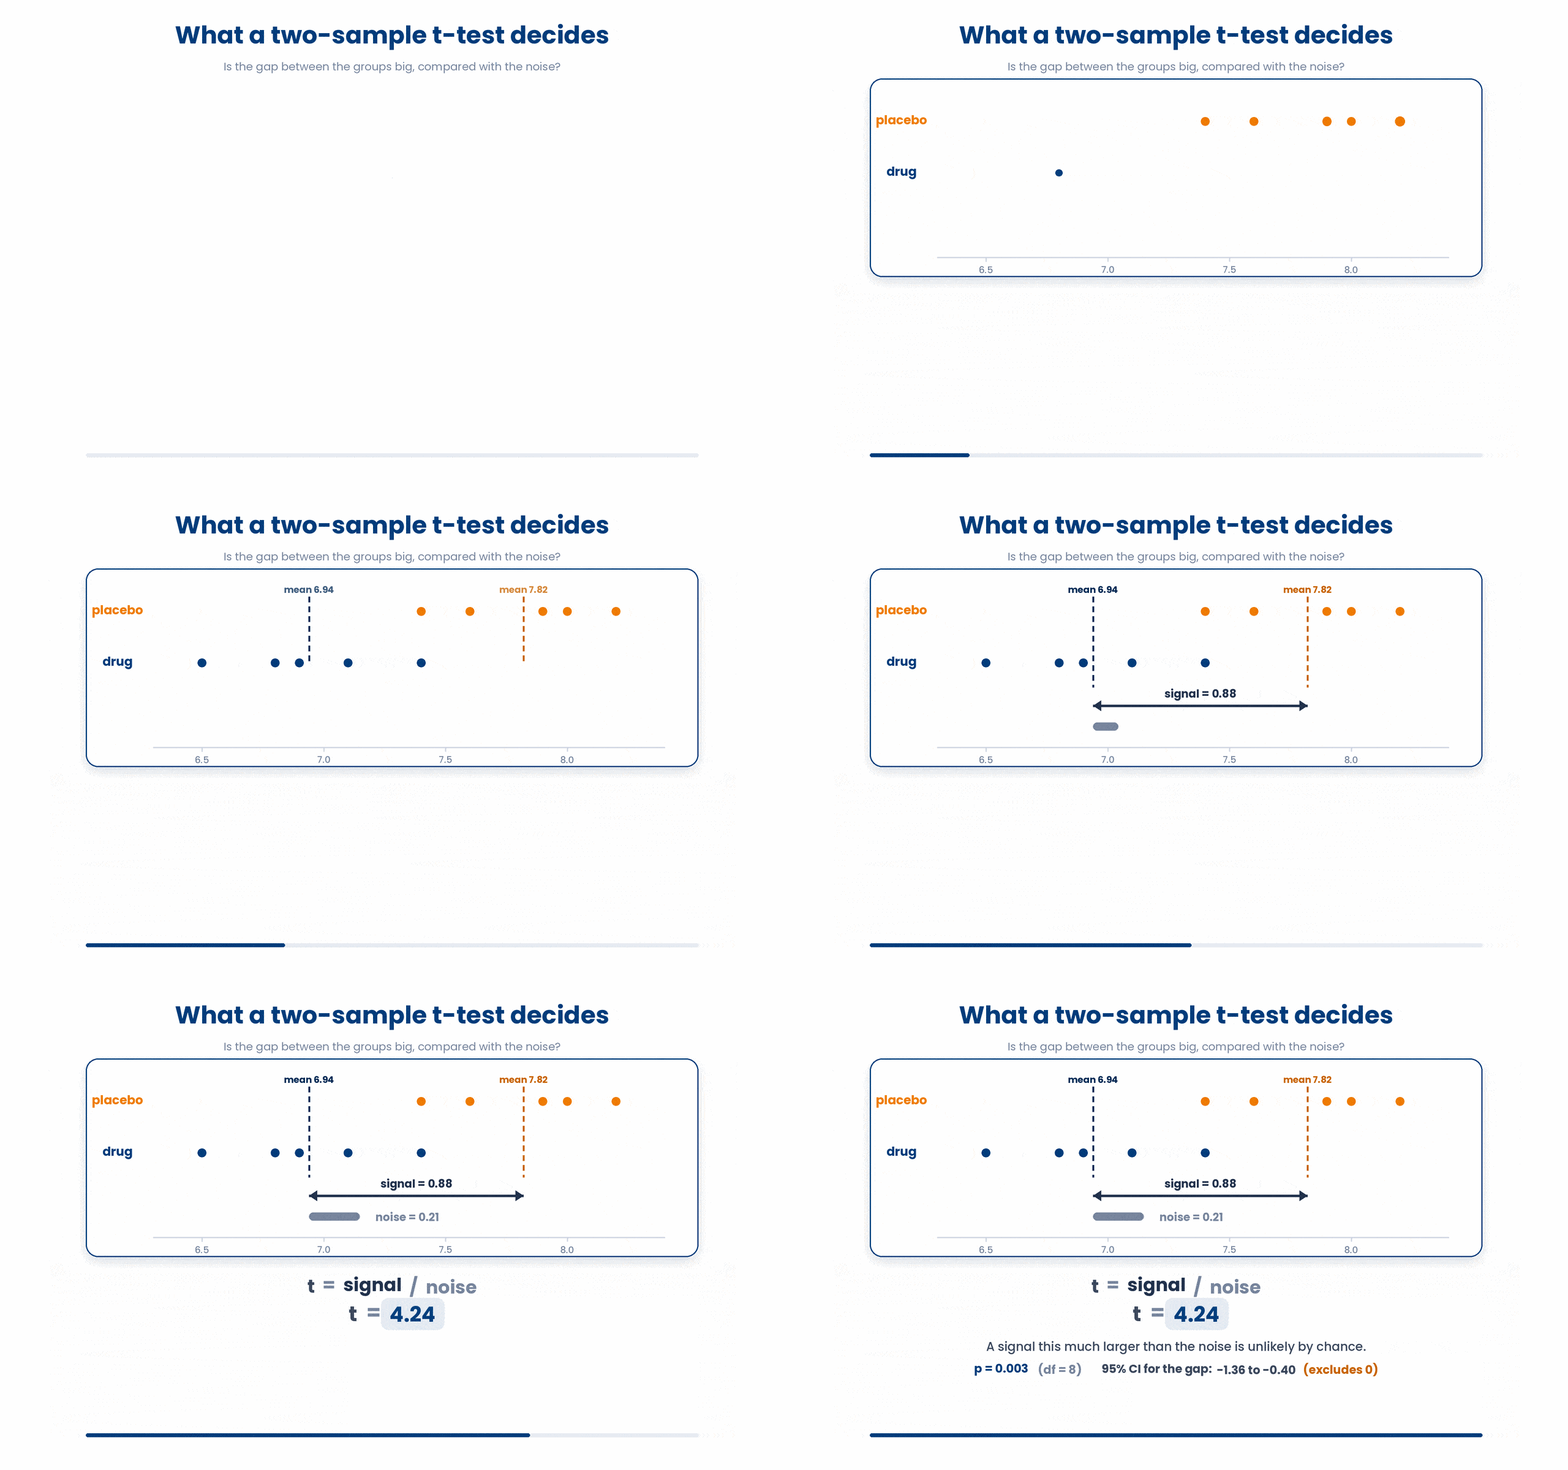
4 Reading a p-value correctly
The p-value from the last section is the single most misread number in all of statistics. Getting its meaning exactly right is worth more than any test you will learn this module.
A p-value is the probability of getting data at least as extreme as what you observed, assuming the null hypothesis is true. It is a statement about the data given H0 — not a statement about H0 given the data.
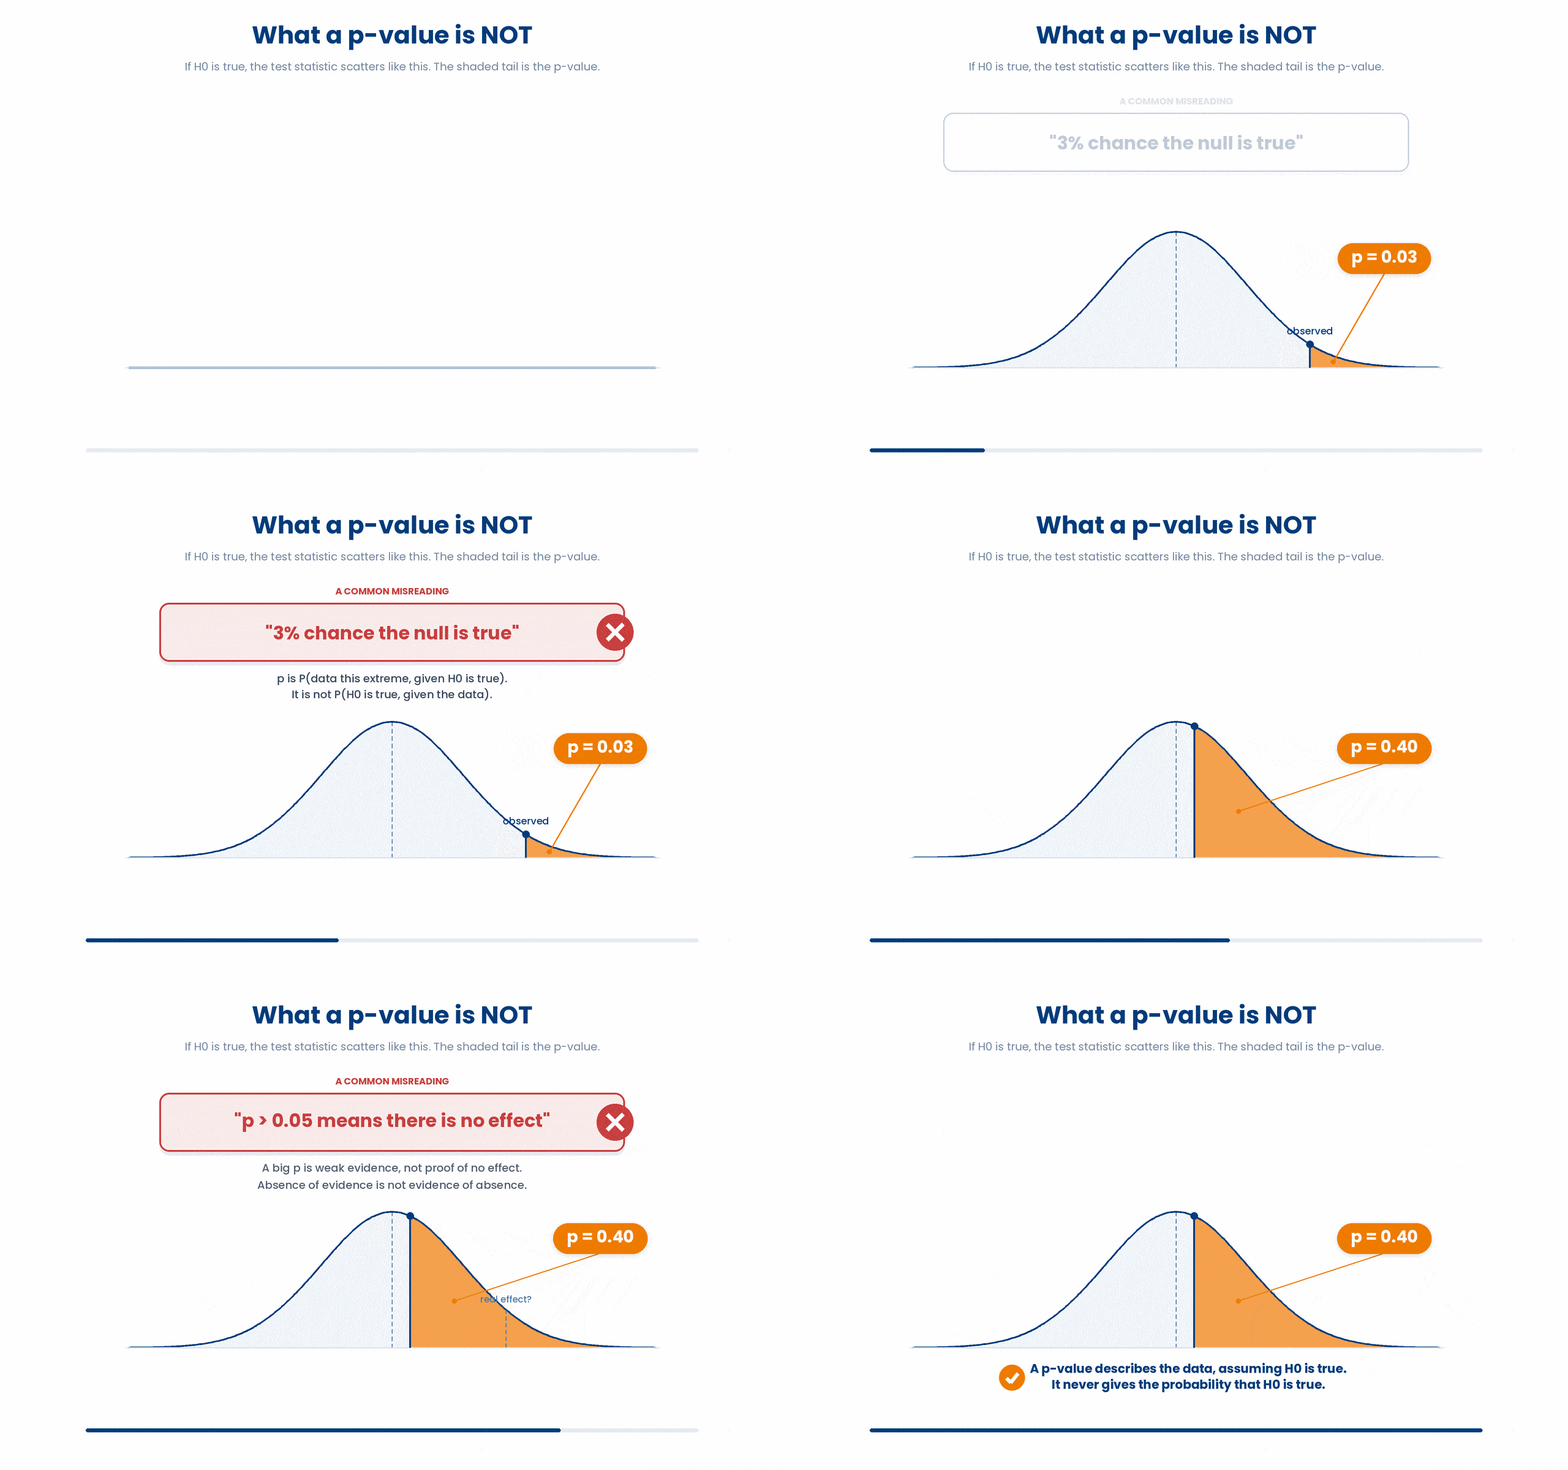
So the famous misreading is wrong: "p = 0.03 means a 3% chance the null is true". The p-value is not the probability that H0 is true. It assumes H0 is true and then measures how unusual your data are under that assumption. The probability that H0 is true is a different quantity the test never computes.
The second trap is just as common: treating p > 0.05 as proof of no difference. A large p-value is not evidence that the null is true — it only means you did not find enough evidence to reject it. Absence of evidence is not evidence of absence. A tiny study can return p = 0.40 while a real effect sits there, simply hidden by noise.
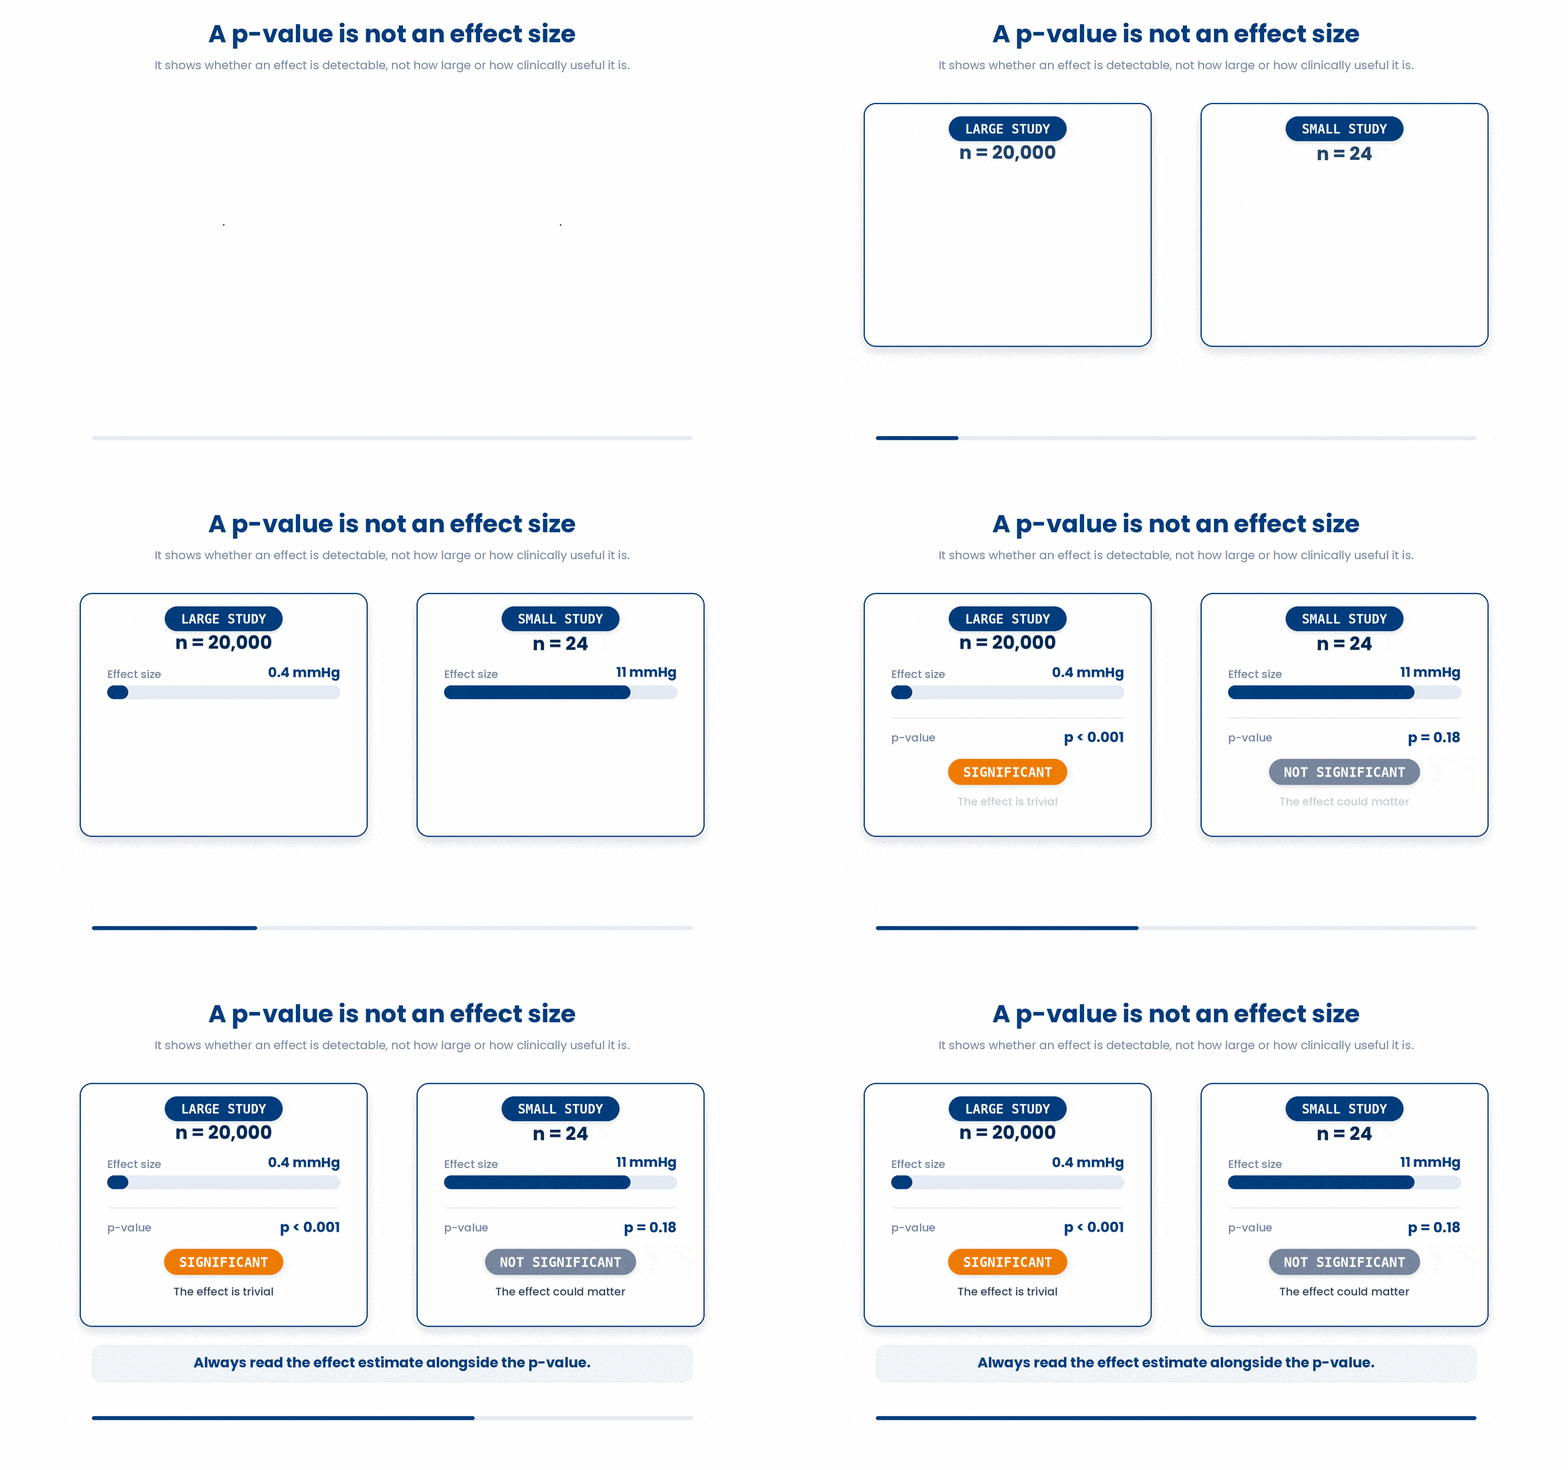
A p-value is also not an effect size. It tells you whether an effect is detectable, never how big or how clinically useful it is. A trivial difference can be highly significant in a huge sample, and an important difference can be non-significant in a small one. Always read the effect estimate alongside the p-value.
5 Check your understanding
You have reached the end of the module. Try the same questions again — your answers here, paired with your pre-test answers, are how we measure what the module taught you. Answer every question and confidence rating, then click Submit and see results to view your score.
A hypothesis test starts by writing down two competing claims. What does the null hypothesis (H0) state?
You trial a new drug to lower HbA1c against placebo. Which is a correctly framed null hypothesis?
For the same HbA1c trial, which statement is a correctly framed alternative hypothesis (H1)?
In a two-sample t-test, what does the t-statistic measure?
Where does the p-value come from once you have a test statistic?
A trial reports p = 0.03. Which interpretation is correct?
A small pilot trial returns p = 0.30. What can you conclude?
With 10,000 patients, a mean HbA1c difference of 0.02% reaches p < 0.001. What does this illustrate about the p-value?
I can state a null and alternative hypothesis for a clinical question and explain what a test assumes about H0.
I can explain what a test statistic and p-value represent and run a two-sample comparison with t.test().
I can explain in plain words what a p-value does and does not mean, and reject the classic misreadings on sight.
6 Your results
Here is how your post-test answers compare with your pre-test answers. The pre/post pairing is the most reliable way to see what this module actually taught you.
Submit the post-test to see your results.
What is the one thing from this module that is still unclear to you?