

1 Before you start
This is not graded, and it does not count towards anything. Answer every question even if you are only guessing — having a go at something before you have been taught it is one of the best ways to remember it afterwards. The lesson ends with another short check, and there you will be shown the correct answer for anything you missed. Choose an option for every question and confidence rating, then click Submit answers.
df.sort_values("age") by default returns what?
df_a and df_b have the same columns. What does pd.concat([df_a, df_b], ignore_index=True) return?
df.groupby("clinic")["age"].mean() returns which kind of object?
You write df.apply(lambda row: row["weight_kg"] / row["height_m"]**2, axis=1). What does the lambda receive each call?
df["diagnosis"].str.contains("diabetes") returns what?
df.drop_duplicates(subset="patient_id") returns a DataFrame that keeps which copy of each duplicated patient_id?
Several columns in df contain scattered NaN values. What does plain df.dropna() do by default?
A column of integers contains one missing value. After read_csv, what dtype does pandas give it?
I can apply a custom function to every row of a DataFrame with .apply and a lambda, and explain what the function sees each call.
I can clean a text column with the .str accessor — for example, lowercase every entry or filter rows where the text contains a keyword.
I can decide whether to drop or fill missing values for a given column, and write the code for either.
2 Introduction
In Part I you learned how to get data into a DataFrame and pull out the rows that matter. Part II is the next layer: cleaning and transforming a single DataFrame — sorting it, grouping it, running custom functions on each row, scrubbing text columns, removing duplicate rows, and handling the missing values that real data always has.
This is the second of three parts on pandas. Part III will cover reshaping (wide / long), combining multiple DataFrames, encoding categories for downstream tools, chaining operations into pipelines, and bridging to NumPy.
This part covers five tools. They are the bread-and-butter operations for turning a raw DataFrame into something analysis-ready:
- Basic data manipulation — sorting, stacking, and grouping with
groupby. - Row-wise transforms with
applyandlambda— run any function over each row or value. - Cleaning text columns with the
.straccessor —split,upper,contains, and friends for string columns. - Finding duplicates with
duplicatedanddrop_duplicates— spot and remove repeated rows. - Inspecting and handling missing values —
isna,dropna, andfillna, and the patterns for choosing between them.

Try every snippet in the Python Scratchpad on the right. By the end of this part you will read a messy patient CSV, drop the duplicates, fill the gaps, group by clinic, and produce a clean per-group summary.
3 Basic data manipulation
Once you can select what you want, the next set of moves transforms it. Four small operations cover most everyday data work: sorting rows into a useful order, stacking two tables to make one longer one, grouping rows by a category to compute per-group summaries, and adding new columns built from existing ones.
3.1 Sorting
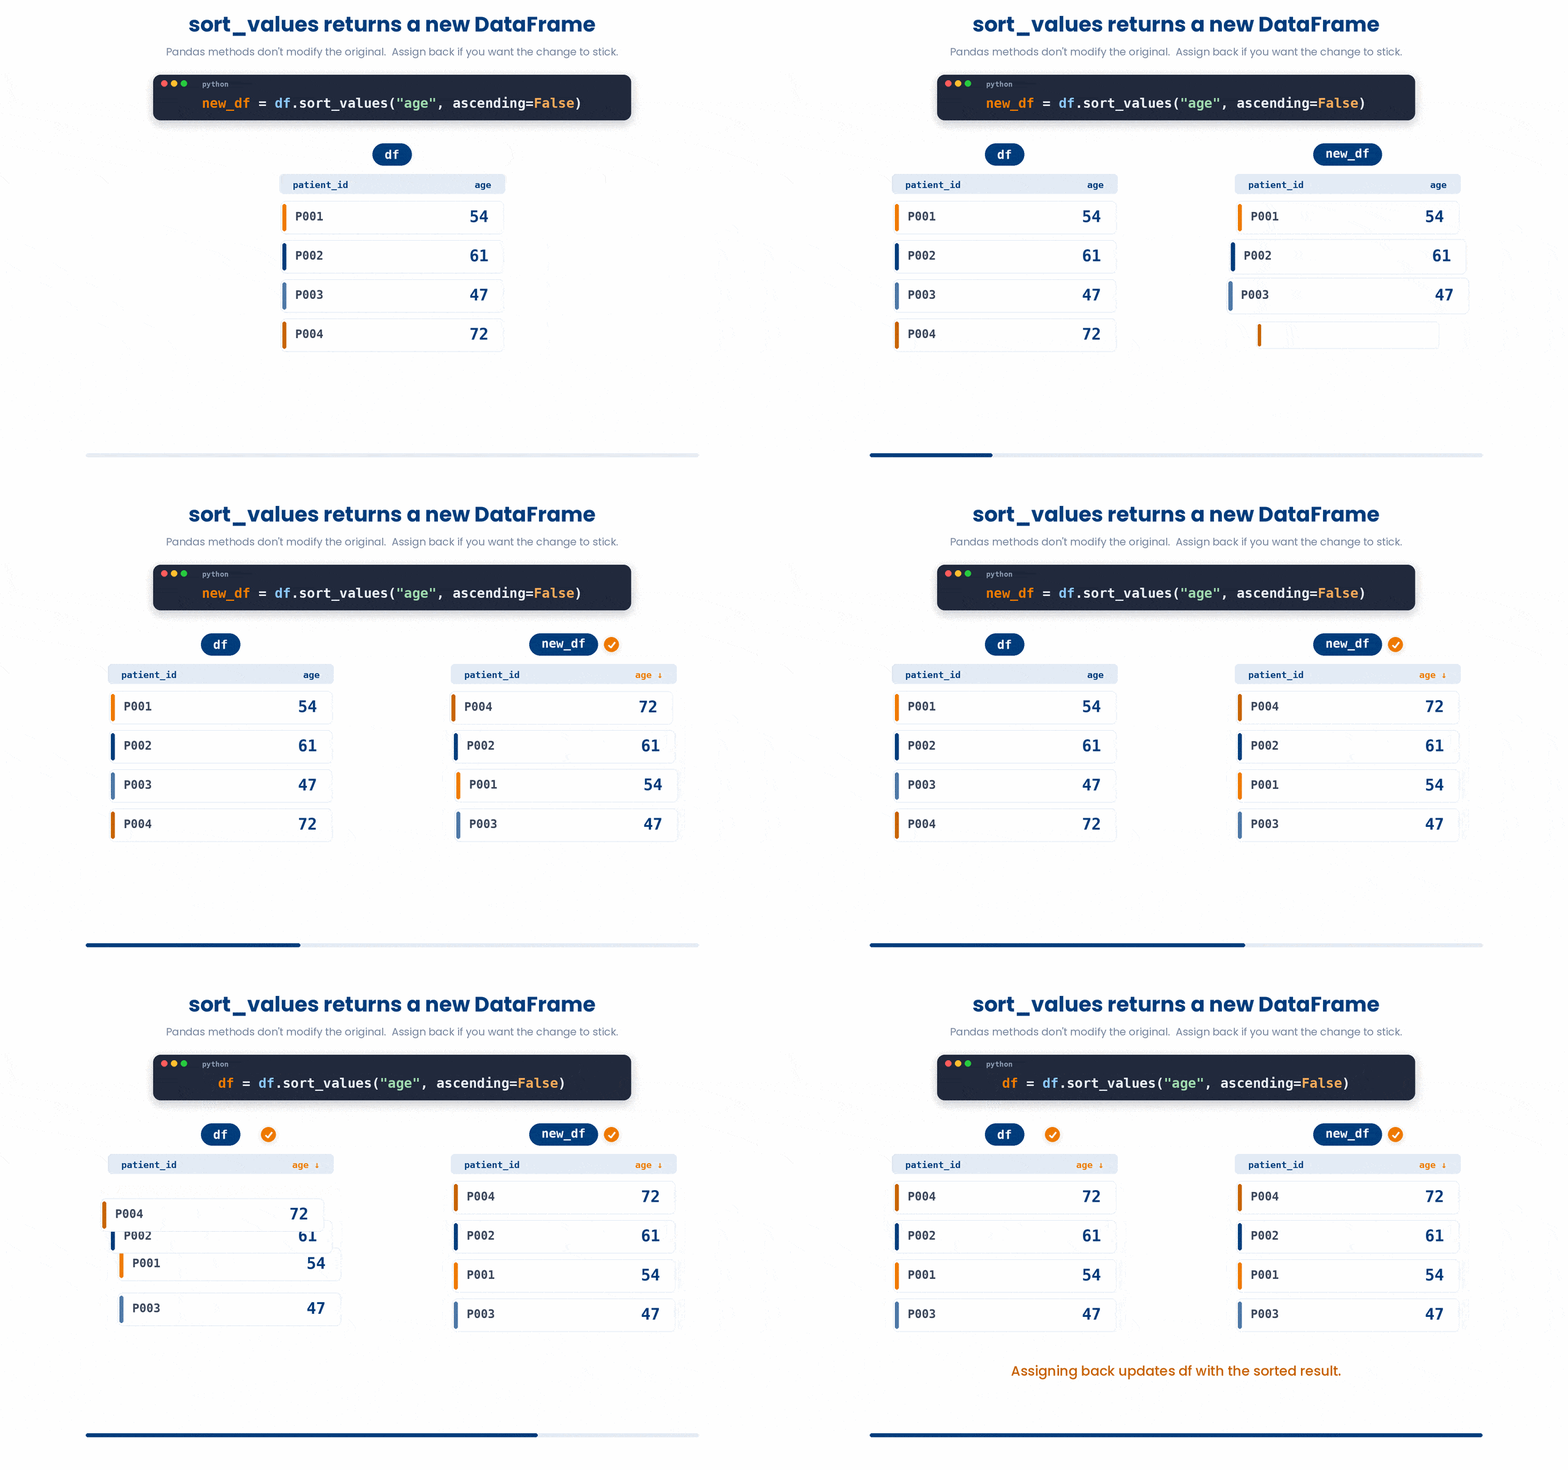
df.sort_values takes the column to sort by as its first argument. While it sorts in ascending order by default, you can pass ascending=False for a descending sort. To break ties, you can pass a list of column names; pandas will then sort by the first column, followed by the second within each group, and so on.
Try this snippet in the Python Scratchpad on the right.
import pandas as pd

df = pd.DataFrame({
 "patient_id": ["P001", "P002", "P003", "P004"],
 "clinic": ["A", "B", "A", "B"],
 "age": [54, 61, 47, 72],
})
by_age = df.sort_values("age", ascending=False)
print(by_age)sort_values returns a new DataFrame; it does not modify the original. If you want the change to stick, assign it back: df = df.sort_values("age").
Almost every pandas method behaves this way (returning a new object rather than mutating in place).
Sorting is not limited to one column. Pass sort_values a list of column names and it sorts by the first, breaking ties with the next, exactly as the paragraph above described. Give ascending a matching list of True and False values when each column needs its own direction — the two lists line up positionally, so the first entry of ascending sets the direction for the first column in the list, the second entry sets the direction for the second column, and so on.
Try this snippet in the Python Scratchpad on the right.
import pandas as pd

df = pd.DataFrame({
    "patient_id": ["P001", "P002", "P003", "P004", "P005"],
    "clinic": ["B", "A", "A", "B", "A"],
    "age": [54, 61, 47, 72, 68],
})
by_clinic_then_age = df.sort_values(["clinic", "age"], ascending=[True, False])
print(by_clinic_then_age)Clinics come out A before B because clinic's entry is True; within each clinic the oldest patient comes first because age's entry is False. Give the two lists different lengths and pandas refuses to guess — it raises a ValueError naming the mismatch. Position is everything here, so count carefully once a sort grows past one column.
3.2 Stack with concat
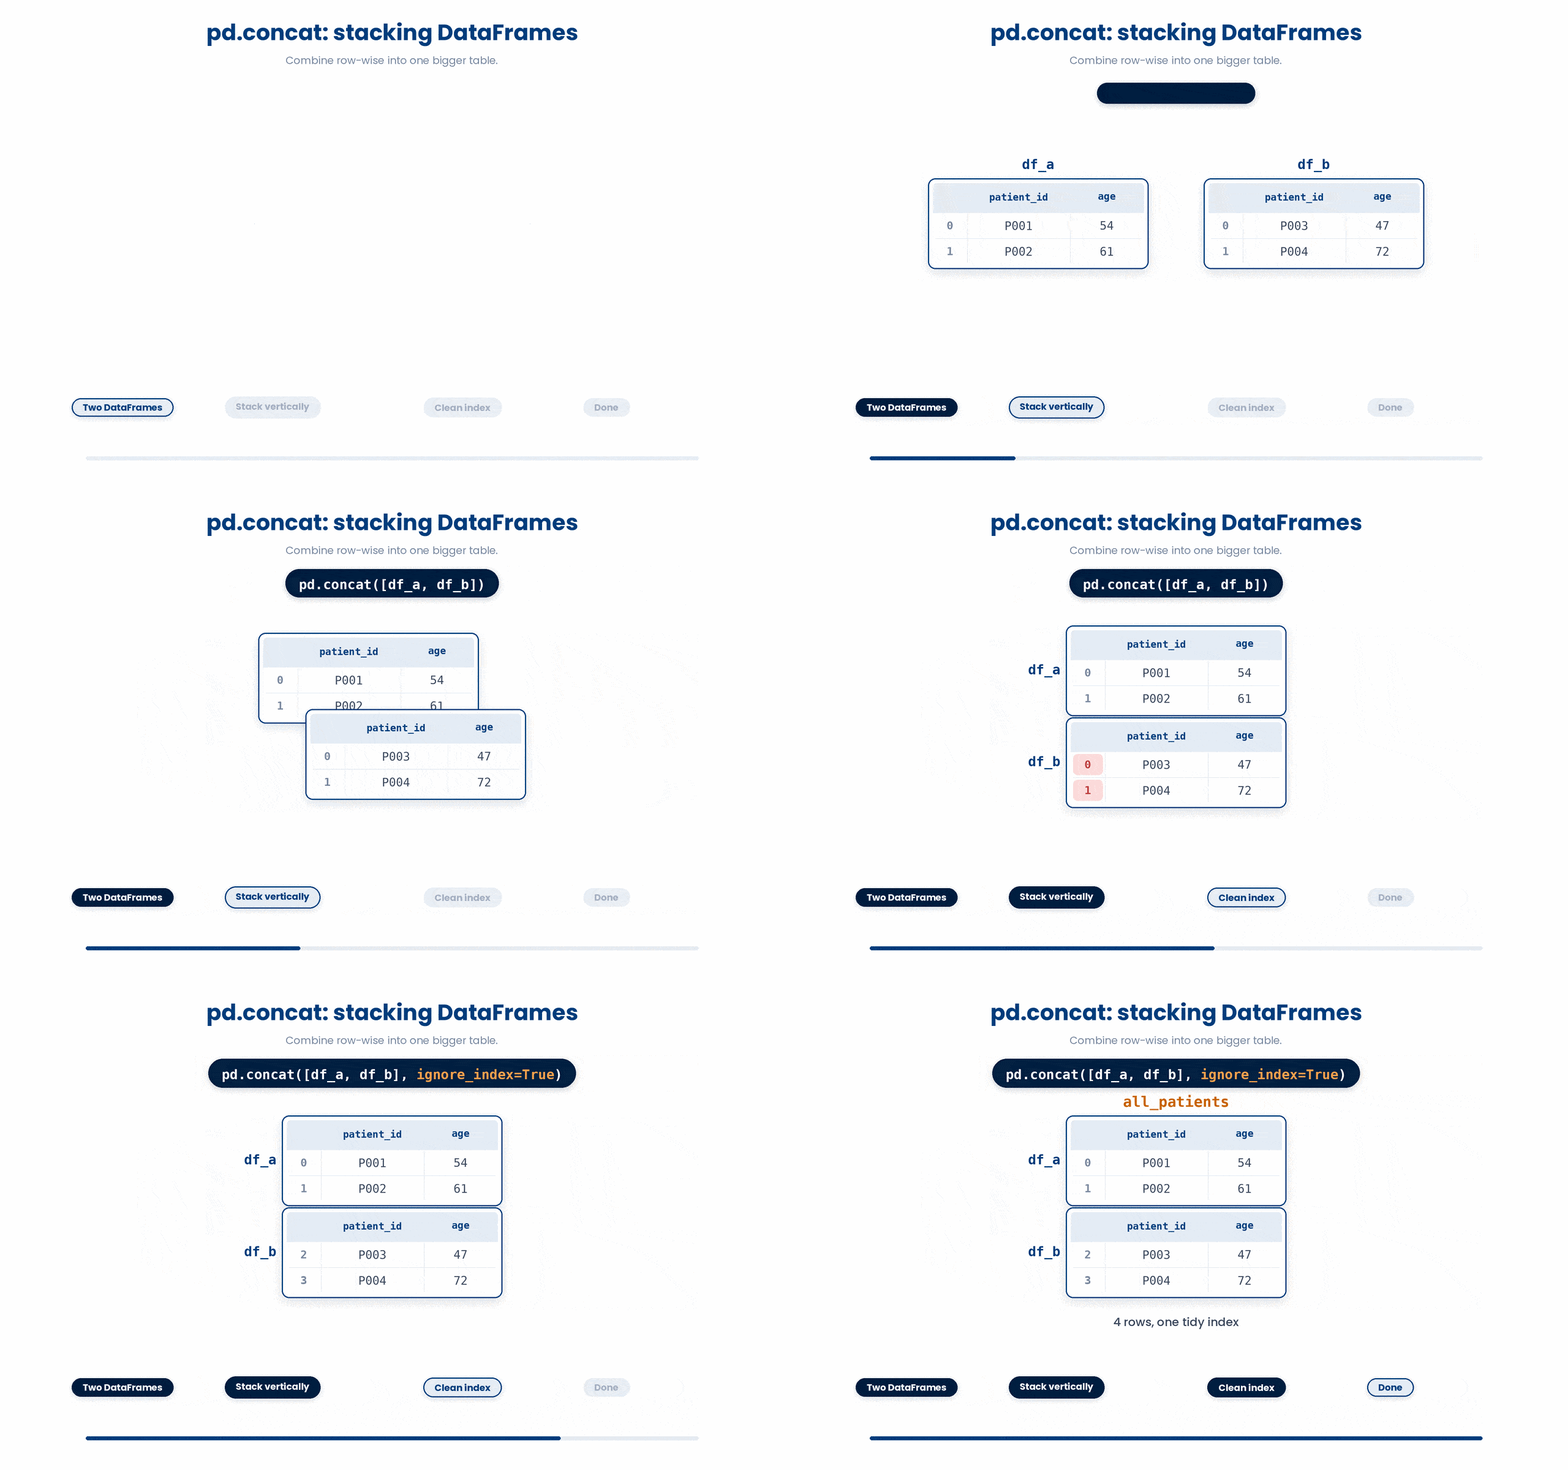
When two DataFrames share the same columns and you want them as one longer table, use pd.concat. This is the right tool for combining month-by-month files into one big table, or pooling two clinics' results.
Try this snippet in the Python Scratchpad on the right.
import pandas as pd

df_a = pd.DataFrame({"patient_id": ["P001", "P002"], "age": [54, 61]})
df_b = pd.DataFrame({"patient_id": ["P003", "P004"], "age": [47, 72]})
all_patients = pd.concat([df_a, df_b], ignore_index=True)
print(all_patients)ignore_index=True asks pandas to renumber the result from 0. Without it, each input keeps its original index, so you would get two rows numbered 0, two numbered 1, and so on. Renumbering is almost always what you want.
3.3 Grouping
Grouping is the move that turns pandas from a fancy spreadsheet into a real analysis tool.
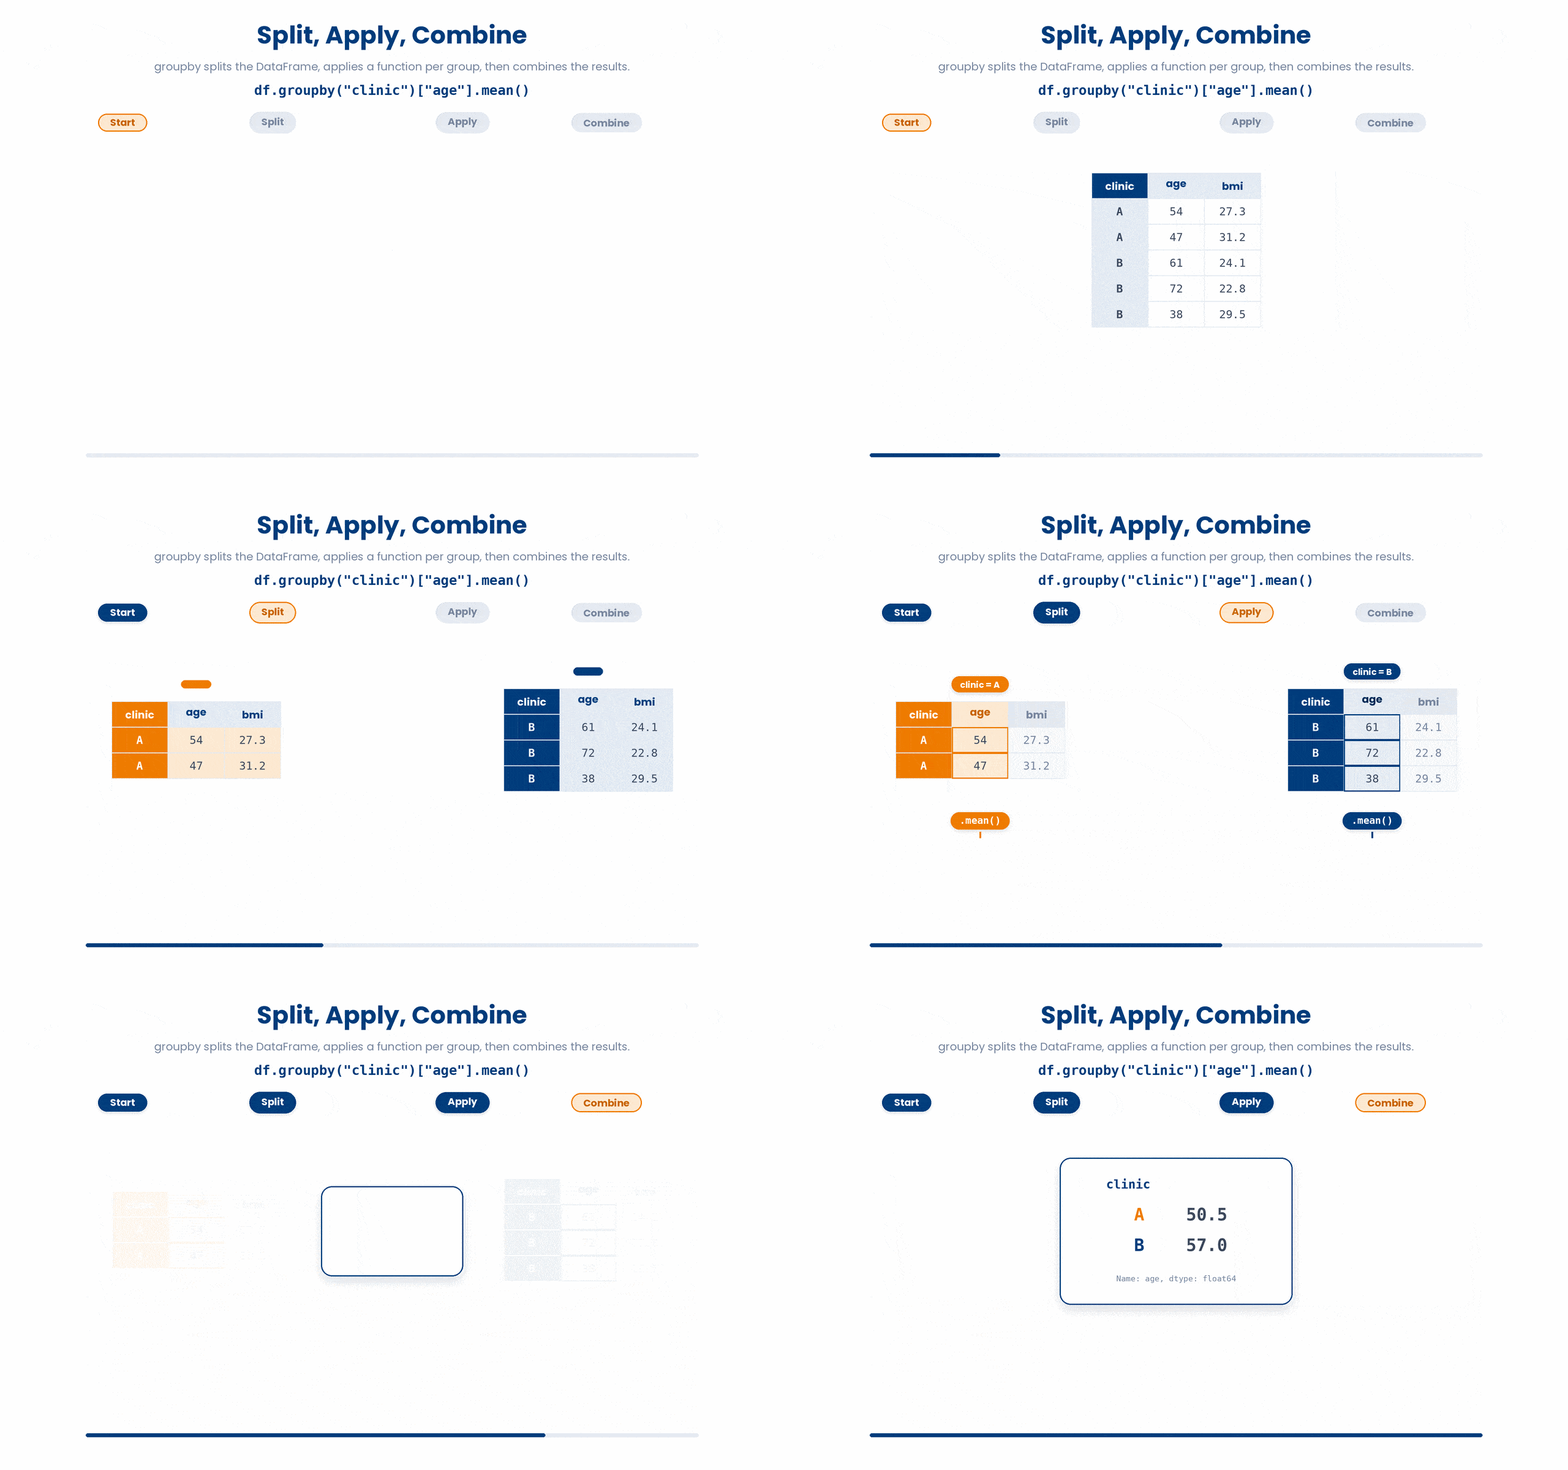
By using df.groupby("clinic"), you split the DataFrame into separate groups based on each unique value in the "clinic" column. This allows you to apply a summary function to all of those groups simultaneously.
Try this snippet in the Python Scratchpad on the right.
import pandas as pd

df = pd.DataFrame({
    "clinic": ["A", "A", "B", "B", "B"],
    "age": [54, 47, 61, 72, 38],
    "bmi": [27.3, 31.2, 24.1, 22.8, 29.5],
})
print(df.groupby("clinic")["age"].mean())Reading the chain from left to right, groupby("clinic") splits the rows into one group per clinic, and ["age"] selects the age column inside each group. Then, .mean() collapses each group into a single number, resulting in a Series with one row per clinic. You can replace .mean() with .median(), .sum(), .count(), or .max() because they all work the same way.
The same groupby reduces several columns at once, and the same single-versus-double-bracket rule from Part I decides the shape you get back. A single column name, df.groupby("clinic")["age"], keeps you in Series territory, so .mean() hands back one number per clinic. A list of column names in double brackets, df.groupby("clinic")[["age", "bmi", "glucose"]], keeps you in DataFrame territory instead, so the same .mean() is applied to every column in the list and you get one summary row per clinic with a column for each.
Try this snippet in the Python Scratchpad on the right.
import pandas as pd

df = pd.DataFrame({
    "clinic": ["A", "A", "B", "B", "B"],
    "age": [54, 47, 61, 72, 38],
    "bmi": [27.3, 31.2, 24.1, 22.8, 29.5],
    "glucose": [5.4, 6.1, 5.9, 7.2, 6.8],
})
print(df.groupby("clinic")[["age", "bmi", "glucose"]].mean())3.4 Multiple summaries with .agg
To compute several summaries in one go, chain .agg after groupby and pass a dictionary mapping each column to the function you want. This is how you build a per-group summary table in one expression.
Try this snippet in the Python Scratchpad on the right.
import pandas as pd

df = pd.DataFrame({
 "clinic": ["A", "A", "B", "B"],
 "age": [50, 60, 40, 80],
 "bmi": [25.0, 27.0, 23.0, 29.0],
})
print(df.groupby("clinic").agg({"age": "mean", "bmi": "max"}))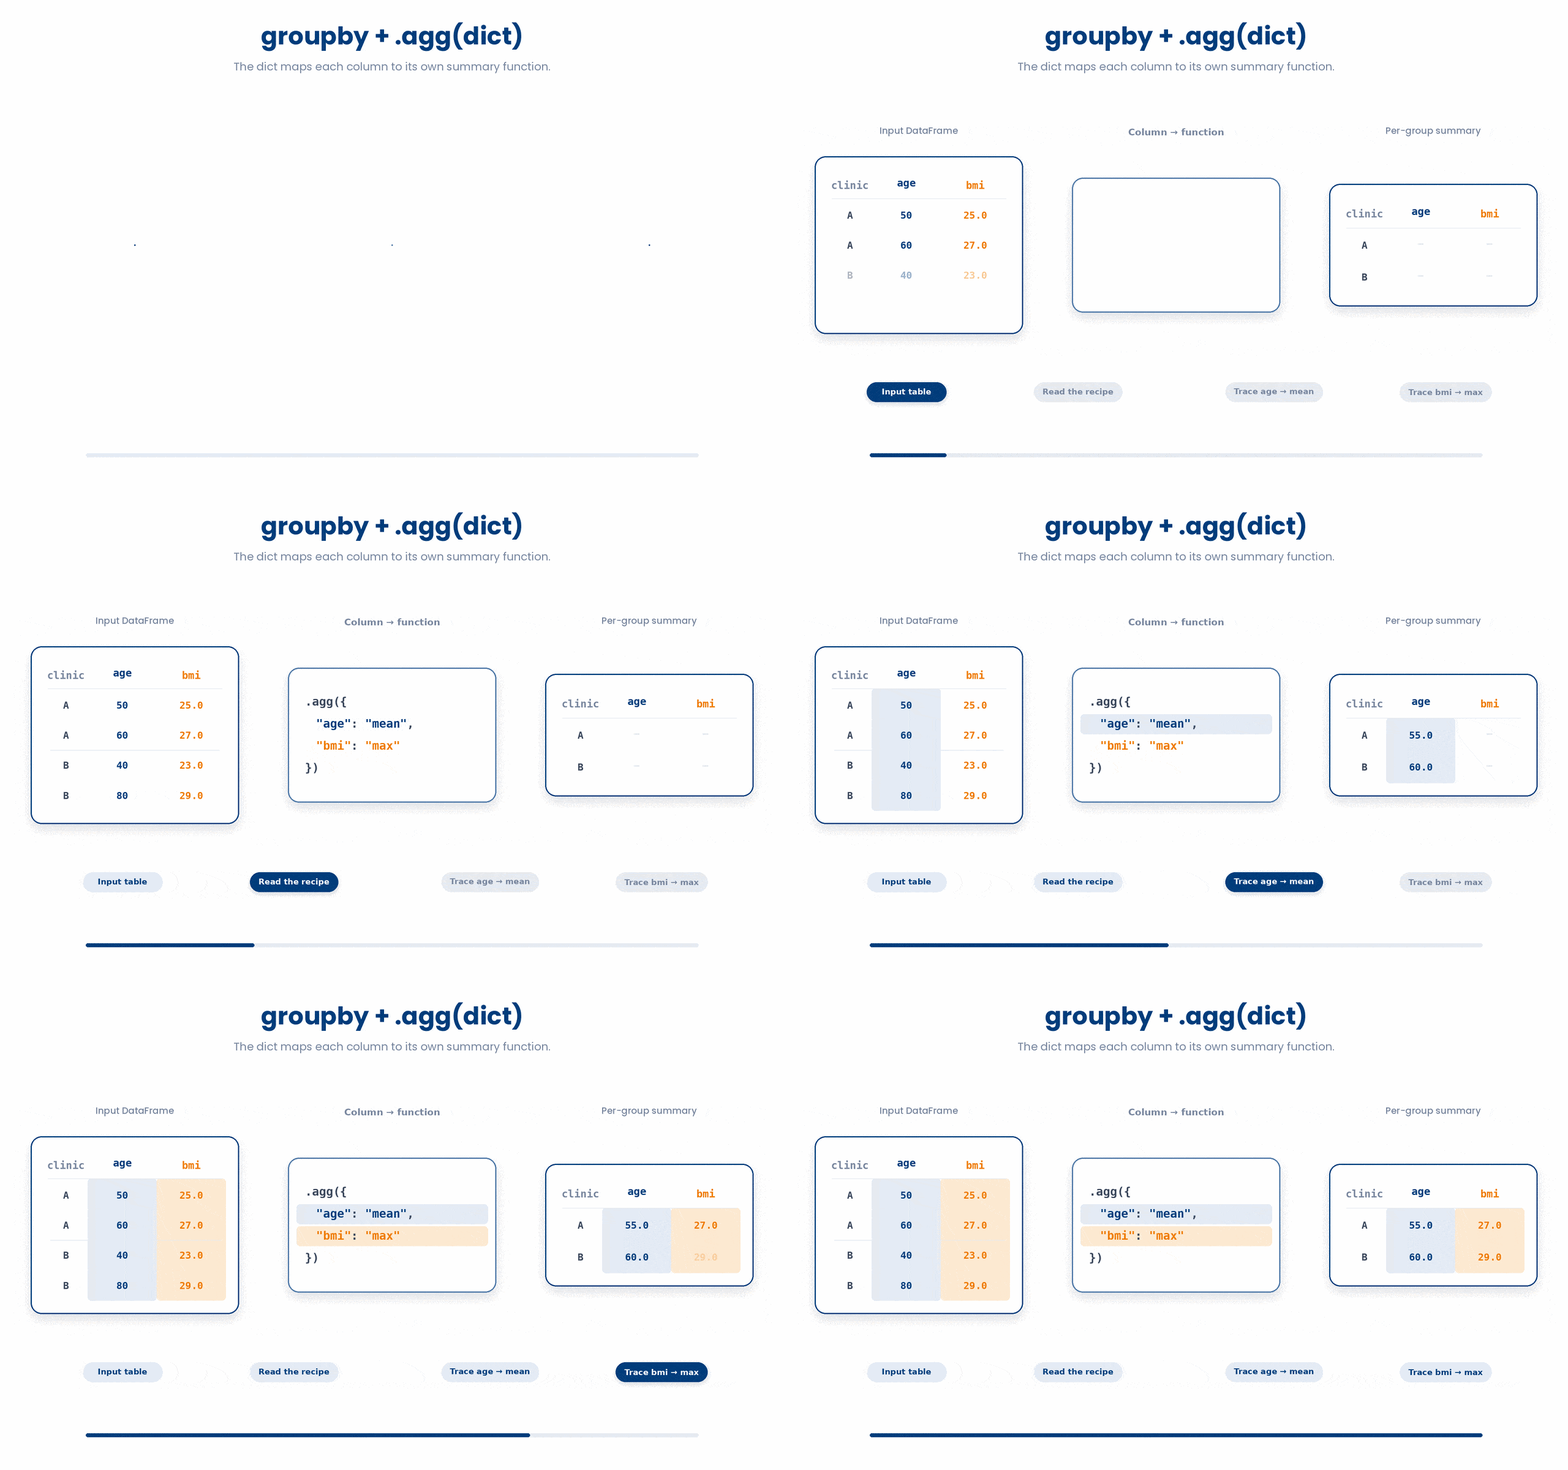
.agg also accepts a plain list instead of a dictionary. A dictionary gives each column its own statistic, as above; a list applies the same set of statistics to every column you selected with the double brackets. df.groupby("clinic")[["age", "bmi"]].agg(["mean", "median", "count"]) computes all three for both columns in one call.
Try this snippet in the Python Scratchpad on the right.
import pandas as pd

df = pd.DataFrame({
    "clinic": ["A", "A", "A", "B", "B"],
    "age": [54, 47, 61, 72, 38],
    "bmi": [27.3, 31.2, 24.8, 22.8, 29.5],
})
print(df.groupby("clinic")[["age", "bmi"]].agg(["mean", "median", "count"]))The result has two levels of column headings: the column name (age, bmi) on top and the statistic (mean, median, count) underneath. Keep count in that list whenever you report a mean or a median this way — a mean over three patients and a mean over three hundred are not the same claim, even when the two numbers printed look identical.
3.5 Adding new columns
In pandas, you can easily assign a new column using the syntax df["new_column"] = some_expression.
This expression typically performs a calculation on existing columns, which pandas automatically applies across every row without requiring explicit loops.
Try this snippet in the Python Scratchpad on the right.
import pandas as pd

df = pd.DataFrame({
 "weight_kg": [72, 80, 65],
 "height_m": [1.75, 1.80, 1.60],
})
df["bmi"] = df["weight_kg"] / (df["height_m"] ** 2)
print(df)
4 Row-wise transforms with apply and lambda
When the operation you want is not a built-in pandas method, .apply lets you pass any function (usually a quick lambda) and runs it element by element.
On a Series, the function sees one value at a time.
On a DataFrame with axis=1, the function sees one row at a time as a Series.
Try this snippet in the Python Scratchpad on the right.
import pandas as pd

df = pd.DataFrame({
 "weight_kg": [72, 80, 65],
 "height_m": [1.75, 1.82, 1.68],
})
df["bmi"] = df.apply(lambda row: row["weight_kg"] / row["height_m"] ** 2, axis=1)
print(df)

df["weight_lbs"] = df["weight_kg"].apply(lambda kg: kg * 2.205)
print(df)
5 Cleaning text columns with the .str accessor
When working with text data in pandas—like patient IDs, names, or diagnoses—you can access a specialized toolkit of string methods by using .str.
Instead of writing a loop, you can apply these transformations to the entire column at once. Here are a few common examples:
- Standardize casing –
df["patient_id"].str.upper()converts every ID to uppercase. - Split text –
df["name"].str.split(" ")breaks each name into a list of words based on the spaces. - Search for keywords –
df["diagnosis"].str.contains("diabetes")checks each row for the word"diabetes"and returnsTrueorFalse, which is perfect for filtering your data.
Try this snippet in the Python Scratchpad on the right.
import pandas as pd

df = pd.DataFrame({
    "patient_id": ["p001", "p002", "p003"],
    "diagnosis": ["Type 2 diabetes", "Hypertension", "Type 1 diabetes"],
})
print(df["patient_id"].str.upper())
print(df[df["diagnosis"].str.contains("diabetes")])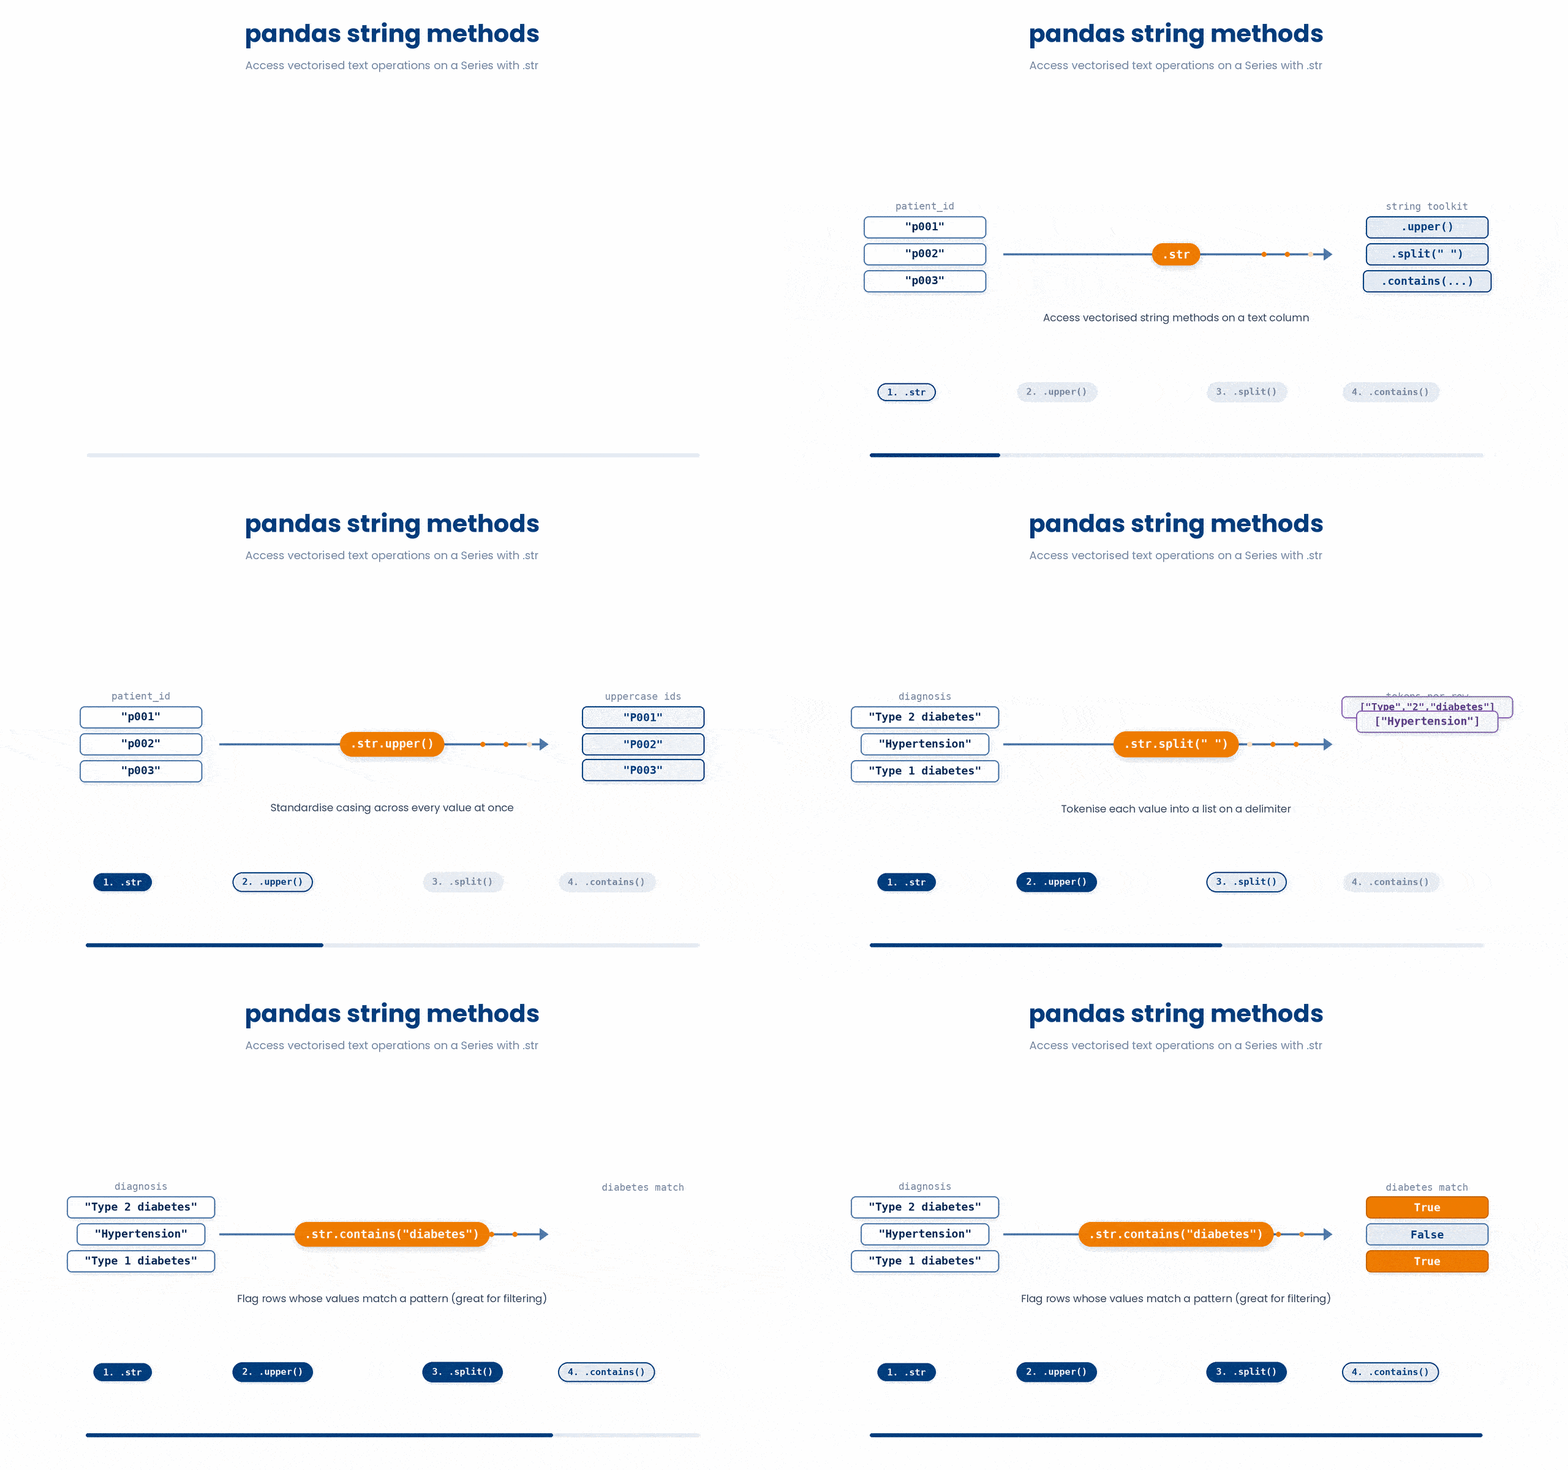
6 Finding duplicates with duplicated and drop_duplicates
Duplicate rows are a common data quality issue, often caused by a patient being entered into a system twice or the same export file being appended multiple times. Pandas provides two key tools to find and remove these duplicates:
df.duplicated()– This scans your data and returns a boolean Series (TrueorFalse). It marks the first time it sees a row asFalse, and flags the second and later copies asTrue.df.drop_duplicates()– This automatically cleans your dataset by keeping only the first copy of a row and dropping all subsequent duplicates.
By default, pandas looks at every column to determine if a row is an exact duplicate. If you only want to check specific identifiers, like ensuring a patient is nott listed twice regardless of other column differences, you can pass the subset argument:
Try this snippet in the Python Scratchpad on the right.
import pandas as pd

df = pd.DataFrame({
    "patient_id": ["P001", "P002", "P001", "P003"],
    "age": [54, 61, 54, 47],
})
print(df.duplicated())
print(df.drop_duplicates(subset="patient_id"))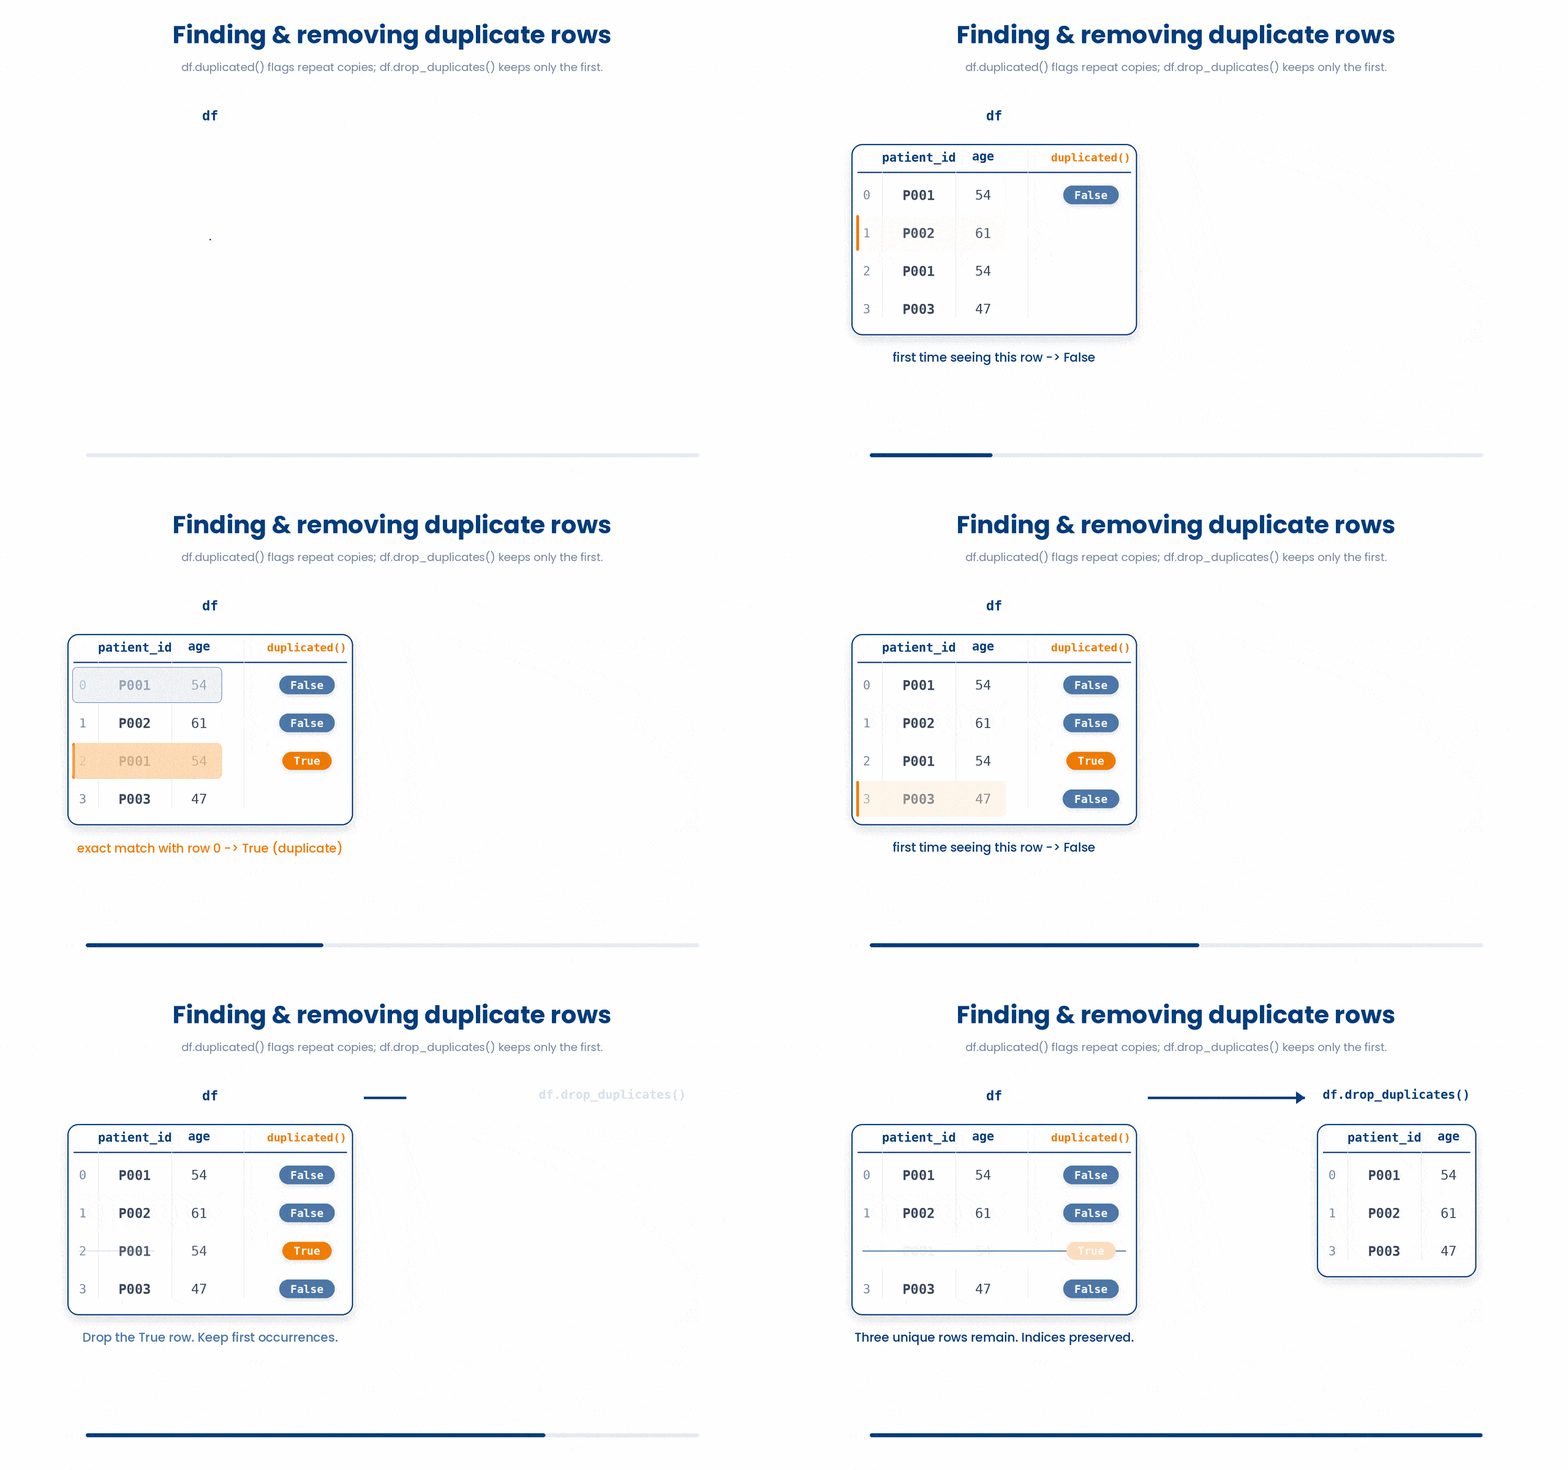
7 Inspecting and handling missing values (isna, dropna)
Real data has gaps. A patient skipped a question on the intake form. An instrument failed for one well of a plate. A column you are now extracting did not exist when an old record was filed. Whatever the cause, the result is the same: empty cells in your table. Pandas represents these as NaN (short for "not a number") and gives you specific tools for finding them and deciding what to do about them.
7.1 Counting number of missing data
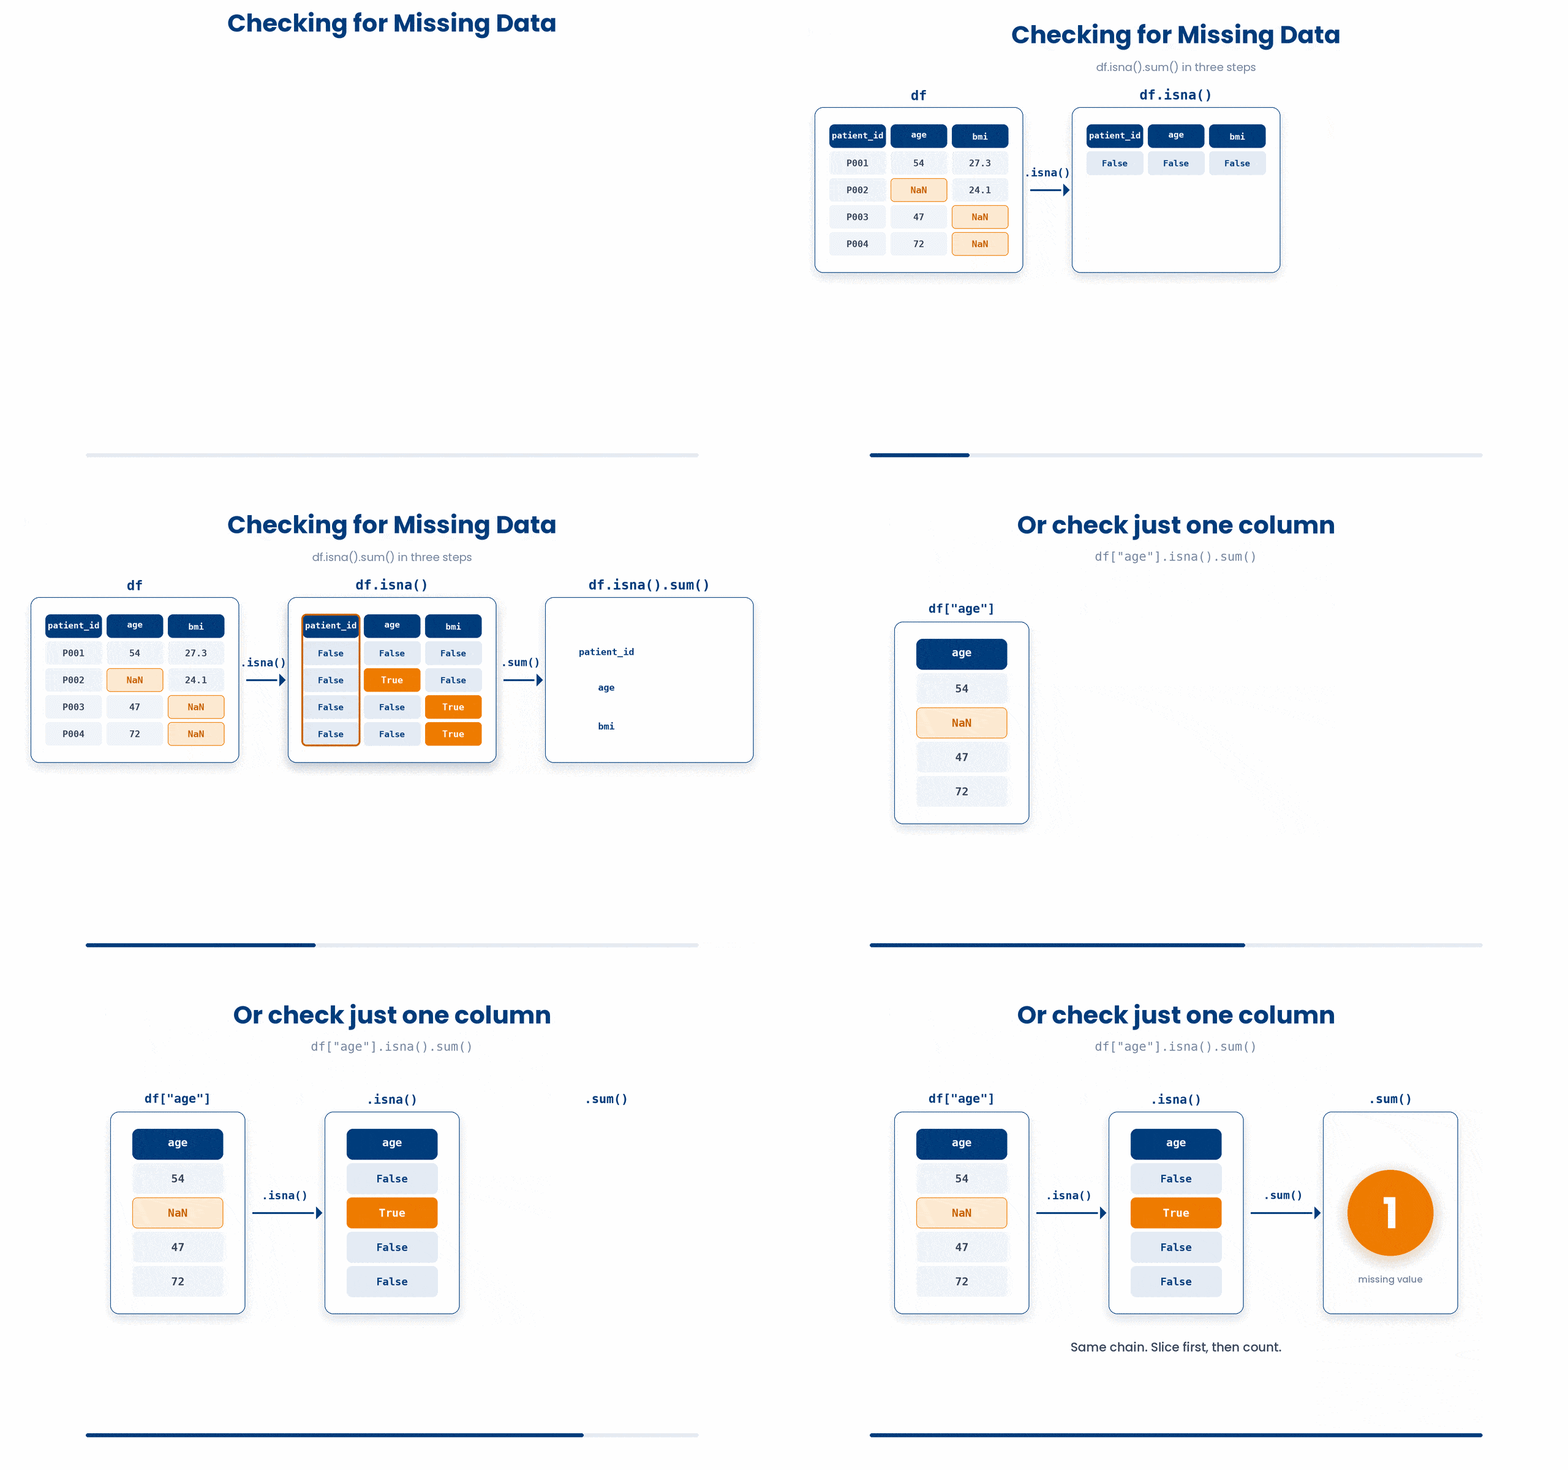
When opening a new dataset, your first step should always be checking for missing data. You can do this by running df.isna().sum(). On its own, df.isna() creates a grid of True (missing) and False (present) values
Adding .sum() forces pandas to count the True values, giving you an instant total of missing entries per column.
Try this snippet in the Python Scratchpad on the right.
import pandas as pd
import numpy as np

df = pd.DataFrame({
 "patient_id": ["P001", "P002", "P003", "P004"],
 "age": [54, np.nan, 47, 72],
 "bmi": [27.3, 24.1, np.nan, np.nan],
})
print(df.isna().sum())To check a specific variable instead of the entire dataset, isolate it using df["age"].isna().sum(). Making this quick check a habit for every new file helps you catch dataset issues. If you have a column missing 90% of its data, you might want to rethink your data collection or analysis approach.
7.2 Handling missing data
Once you know what is missing, you have two choices:
- drop the rows with
dropna - fill them with
fillna.
Plain df.dropna() drops every row that has a missing value in any column, which is usually too aggressive, because a row missing a single irrelevant column gets thrown away with the truly bad rows. The subset argument fixes that: it only looks at the columns you list. df.dropna(subset=["age"]) keeps every row that has an age, regardless of what is or is not missing in the other columns. df.dropna(axis=1) drops columns instead of rows; reach for it when you want to throw out a column that is mostly empty.
![By default pandas df.dropna() drops every row that has any NaN (usually too aggressive), so pass subset=['col'] to only check specific columns, or use axis=1 to drop columns instead of rows.](GIF_pd_dropna.gif)
Try this snippet in the Python Scratchpad on the right.
import pandas as pd
import numpy as np

df = pd.DataFrame({
 "patient_id": ["P001", "P002", "P003"],
 "age": [54, np.nan, 47],
 "bmi": [27.3, 24.1, np.nan],
})
print(df.dropna())
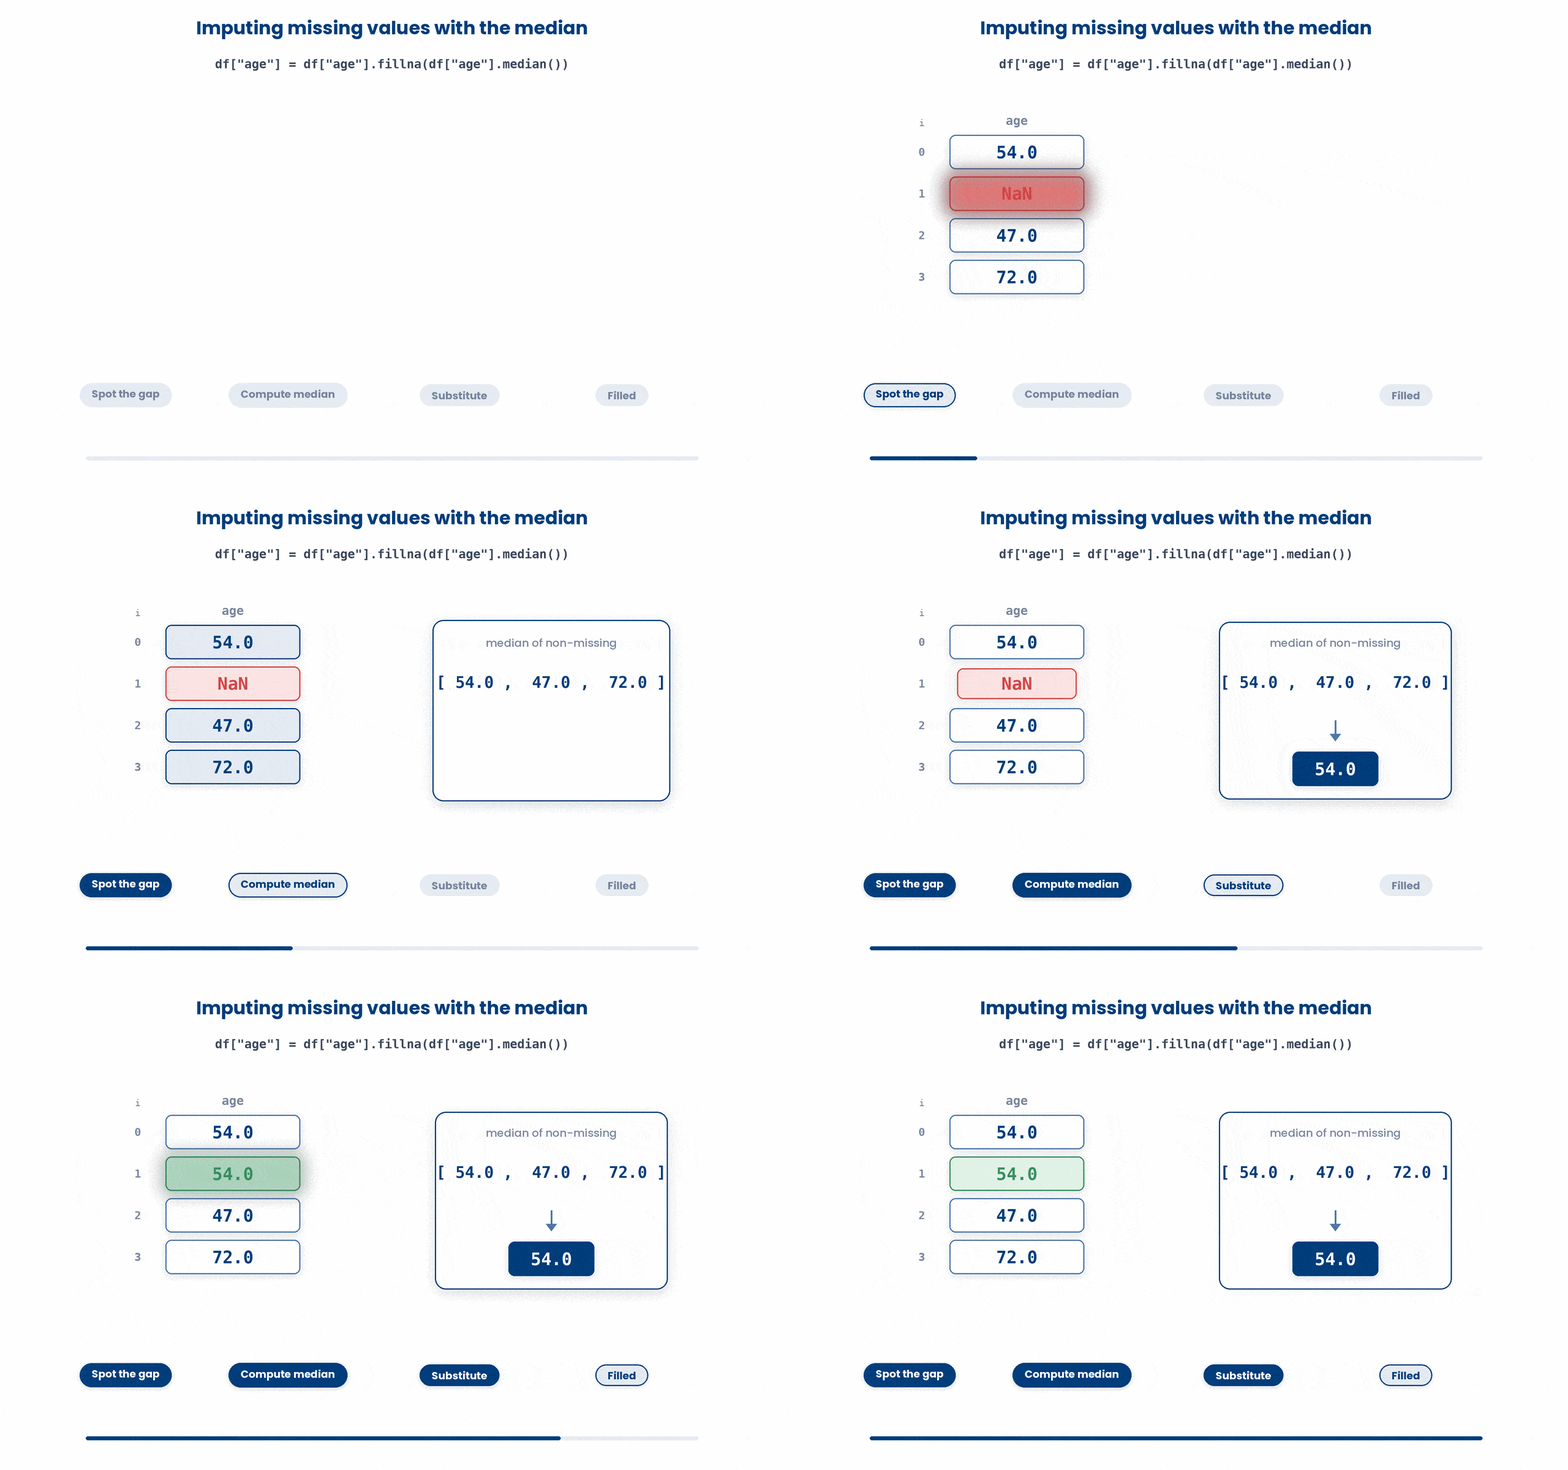
print(df.dropna(subset=["age"]))Filling is the alternative when you cannot afford to lose the rows. df.fillna(0) replaces every NaN with 0, which is fine for some kinds of count data but dangerous for things like age. More often you want a column-specific fill: either by calling fillna on just the column you care about (as below), or by passing a dictionary that maps each column to its own fill value.
Try this snippet in the Python Scratchpad on the right.
import pandas as pd
import numpy as np

df = pd.DataFrame({"age": [54, np.nan, 47, 72]})
df["age"] = df["age"].fillna(df["age"].median()) | age
0 54.0
1 54.0
2 47.0
3 72.0That pattern, replacing missing ages with the median age, is one of the most common imputations in clinical data, and a defensible default. Fancier strategies (mean within a clinic, predicted from other columns) exist, but always document whichever you used. Quietly filling missing values changes the answers your analysis produces.
8 Putting it together
The five tools in this part are the cleaning pass on a real dataset. A typical short script reads a file (from Part I), drops the duplicate rows, fills in the missing values with a sensible default, runs an apply or a .str call to derive a new column, and groups the result for a per-category summary.
Work through this example in three stages. You unlock each stage only after the tutor confirms the previous one. Each stage removes more of the scaffolding — by the end you are writing it yourself.
Problem: You have patients.csv with duplicate patient_id rows, missing BMI values, a free-text diagnosis column, and a clinic column. Drop the duplicates, fill missing BMI with the column median, derive has_diabetes from the diagnosis text, and print the mean BMI per clinic.
import pandas as pd

df = (
    pd.read_csv("patients.csv")
    .drop_duplicates(subset="patient_id")
)
df["bmi"] = df["bmi"].fillna(df["bmi"].median())
df["has_diabetes"] = df["diagnosis"].str.contains("diabetes", case=False)
summary = df.groupby("clinic")["bmi"].mean()
print(summary)- Load the CSV in a chain and immediately drop duplicate patient_id rows, so every later step sees one row per patient.
- Fill the missing BMI values with the column median — the standard impute-with-centre move when a few NaNs would otherwise poison the groupby.
- Derive has_diabetes with a case-insensitive .str.contains on the free-text diagnosis, then group by clinic and print the mean BMI per group.
The same solution with key parts replaced by ???.
Fill in every ??? so the code matches the reference,
then ask the tutor to check it.
Your turn: Build df = pd.DataFrame({"patient_id": [1, 1, 2, 3], "bmi": [24.0, 24.0, None, 30.0]}), drop the duplicate patient_id row, fill the missing BMI with the column median, then print the mean BMI rounded to one decimal.
9 Check your understanding
You have reached the end of the module. Try the same questions again — your answers here, paired with your pre-test answers, are how we measure what the module taught you. Answer every question and confidence rating, then click Submit and see results to view your score.
df.sort_values("age") by default returns what?
df_a and df_b have the same columns. What does pd.concat([df_a, df_b], ignore_index=True) return?
df.groupby("clinic")["age"].mean() returns which kind of object?
You write df.apply(lambda row: row["weight_kg"] / row["height_m"]**2, axis=1). What does the lambda receive each call?
df["diagnosis"].str.contains("diabetes") returns what?
df.drop_duplicates(subset="patient_id") returns a DataFrame that keeps which copy of each duplicated patient_id?
Several columns in df contain scattered NaN values. What does plain df.dropna() do by default?
A column of integers contains one missing value. After read_csv, what dtype does pandas give it?
I can apply a custom function to every row of a DataFrame with .apply and a lambda, and explain what the function sees each call.
I can clean a text column with the .str accessor — for example, lowercase every entry or filter rows where the text contains a keyword.
I can decide whether to drop or fill missing values for a given column, and write the code for either.
10 Your results
Here is how your post-test answers compare with your pre-test answers. The pre/post pairing is the most reliable way to see what this module actually taught you.
Submit the post-test to see your results.
What is the one thing from this module that is still unclear to you?