

1 Before you start
This is not graded, and it does not count towards anything. Answer every question even if you are only guessing — having a go at something before you have been taught it is one of the best ways to remember it afterwards. The lesson ends with another short check, and there you will be shown the correct answer for anything you missed. Choose an option for every question and confidence rating, then click Submit answers.
ages is a NumPy array. Which of these raises an error because the method does not exist?
patients is a 2D array with one row per patient and columns age, weight, height. Which call returns the mean age, mean weight, and mean height (one value per column)?
You write ages[ages >= 50 and ages < 70] and Python raises a ValueError. What is the fix?
You want a new array the same length as ages, where each element is "senior" or "adult" depending on whether the age is at least 65. Which call does this?
In np.where(mask, a / b, a) some entries of b are 0, and Python warns about dividing by zero even for elements that take the False branch. Why?
bmi is a NumPy array. What does bmi.argmax() return?
values contains some np.nan entries. Why does values == np.nan fail to find them?
ages = np.array([54, 61, 47, 72, 38]). What does ages[ages >= 60] return?
I can compute the mean, median, and standard deviation of a 1D array, and use the axis argument to summarise a 2D array down its rows or columns.
I can filter an array with a boolean condition, combine two conditions with the symbol & or |, and use np.where to build a new array of transformed values.
2 Introduction
In Part I you saw how a NumPy array speeds up the arithmetic and indexing that plain Python lists handle clumsily. The next three ideas turn an array into something you can actually analyse: you ask a question of the whole array at once, you keep only the values that match a condition, and you transform values based on a condition.
These three skills - summary statistics, boolean filtering, and conditional transforms - are how you get from a raw column of numbers to a one-line answer or a cleaned-up array.
This second part of the NumPy module covers:
- Statistical operations - mean, median, standard deviation, sum, min, and max, on a whole array or along a chosen axis.
- Boolean indexing and filtering - using a comparison to keep only the elements you want, and combining several conditions with
&and|. - Conditional transforms with
np.where- a vectorisedif/elsethat builds a new array from an old one, replacing or relabelling values in one shot.

Try every snippet in the Python Scratchpad on the right. By the end of this part you will summarise a patient array with mean, median, and standard deviation, filter rows that match a clinical condition, and use np.where to relabel values in one shot.
3 Statistical operations (mean, median, std)
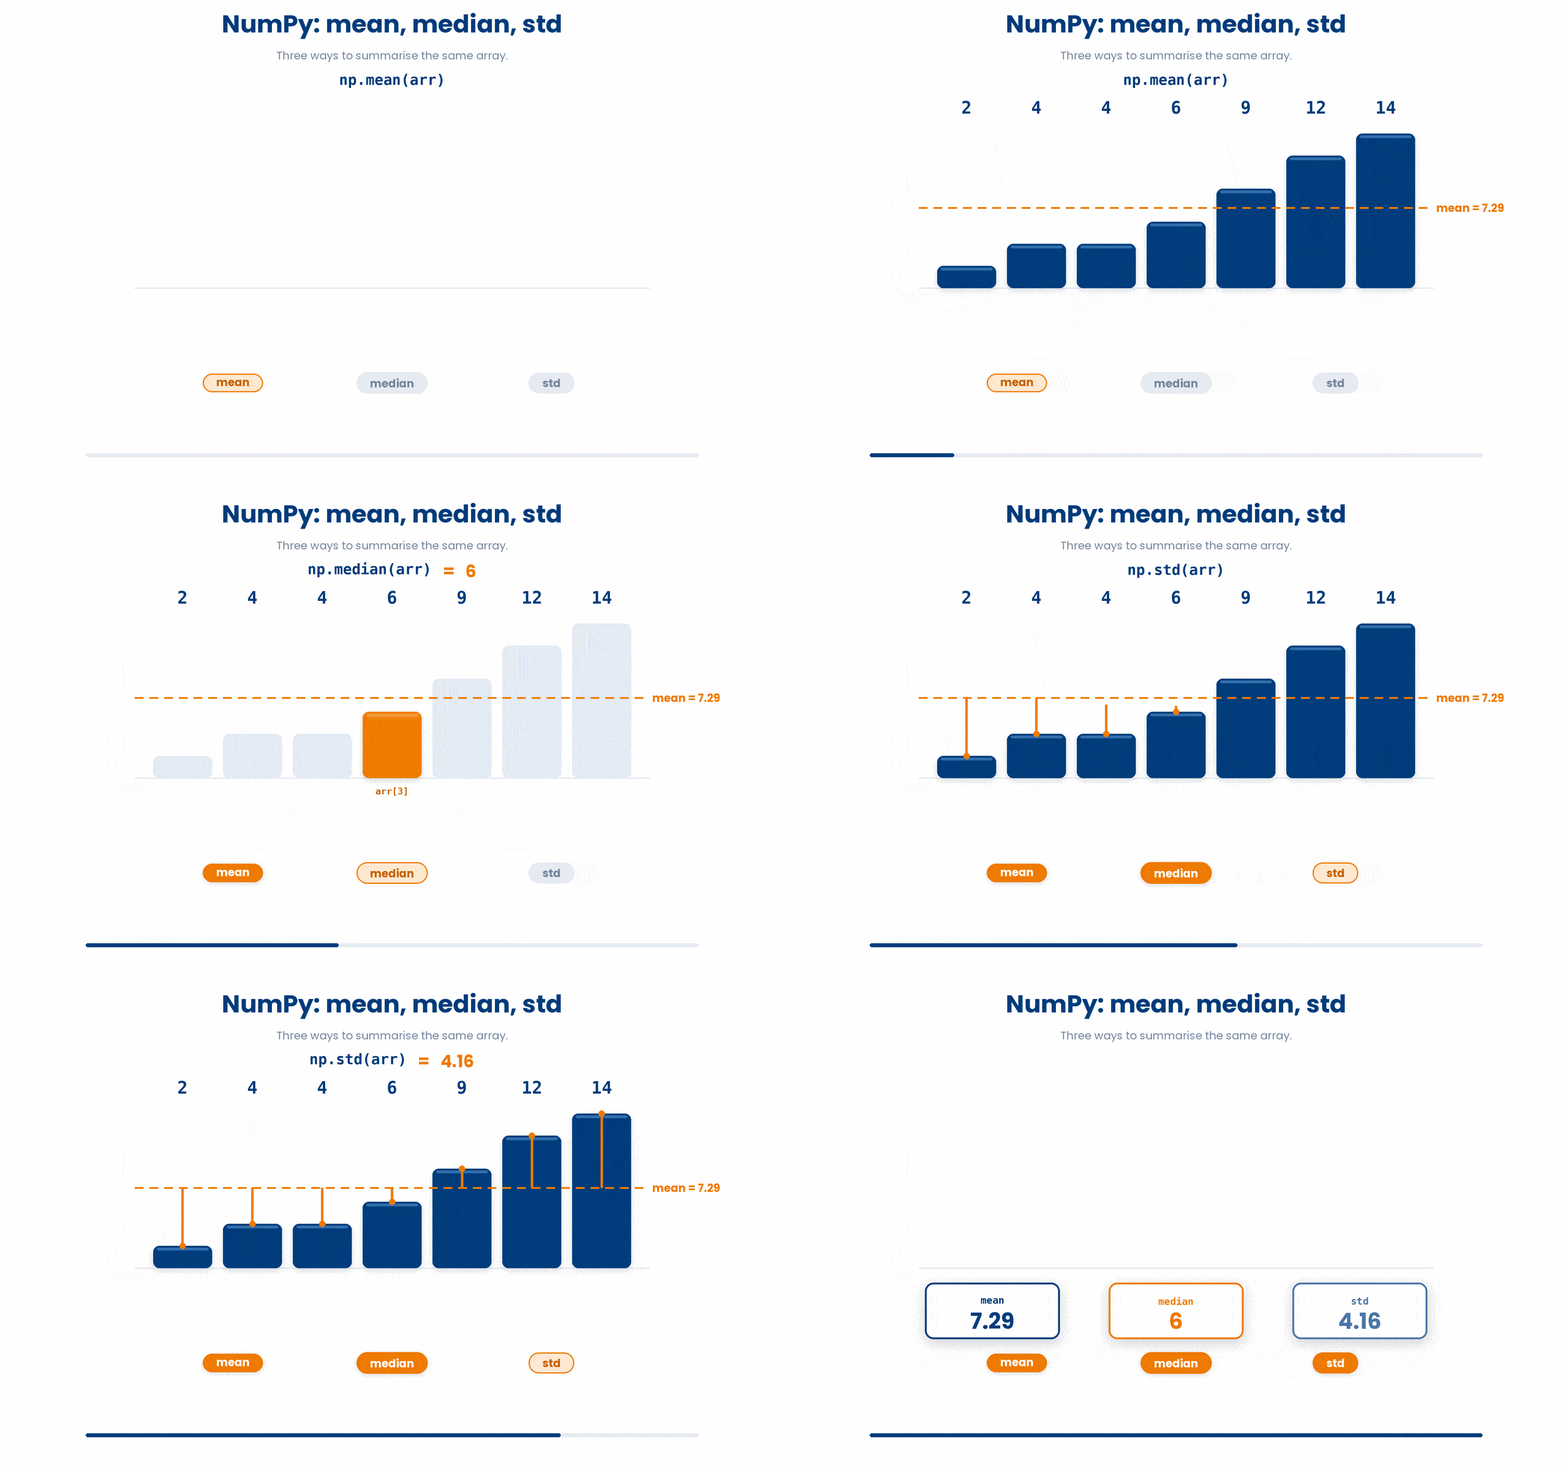
Once your data is in a NumPy array, generating a statistical summary it is virtually effortless. NumPy provides built-in methods for all routine summary statistics. Instead of writing manual loops or importing the statistics module, you can just ask the array to summarize itself. These methods instantly collapse your entire dataset down to a single number—or, in the case of 2D arrays, cleanly into a specific row or column.
Try this snippet in the Python Scratchpad on the right.
import numpy as np
ages = np.array([54, 61, 47, 72, 38])
print(ages.mean())
print(np.median(ages))
print(ages.std())Let’s break down the three statistics happening in this snippet:
- Mean (
ages.mean()): Calculates the average (the sum divided by the count). In this case, it returns54.4. - Median (
np.median(ages)): Finds the exact middle value when the data is sorted. Here, it returns54. - Standard Deviation (
ages.std()): Measures how spread out the data is.
Note: For mean and standard deviation, NumPy is flexible. You can use them as array methods (ages.mean()) or as NumPy functions (np.mean(ages)). Both do the exact same thing.
However, median is an exception. It only exists as a NumPy function (np.median). If you try to type ages.median(), Python will give you an error.
A few more summaries you will use all the time:
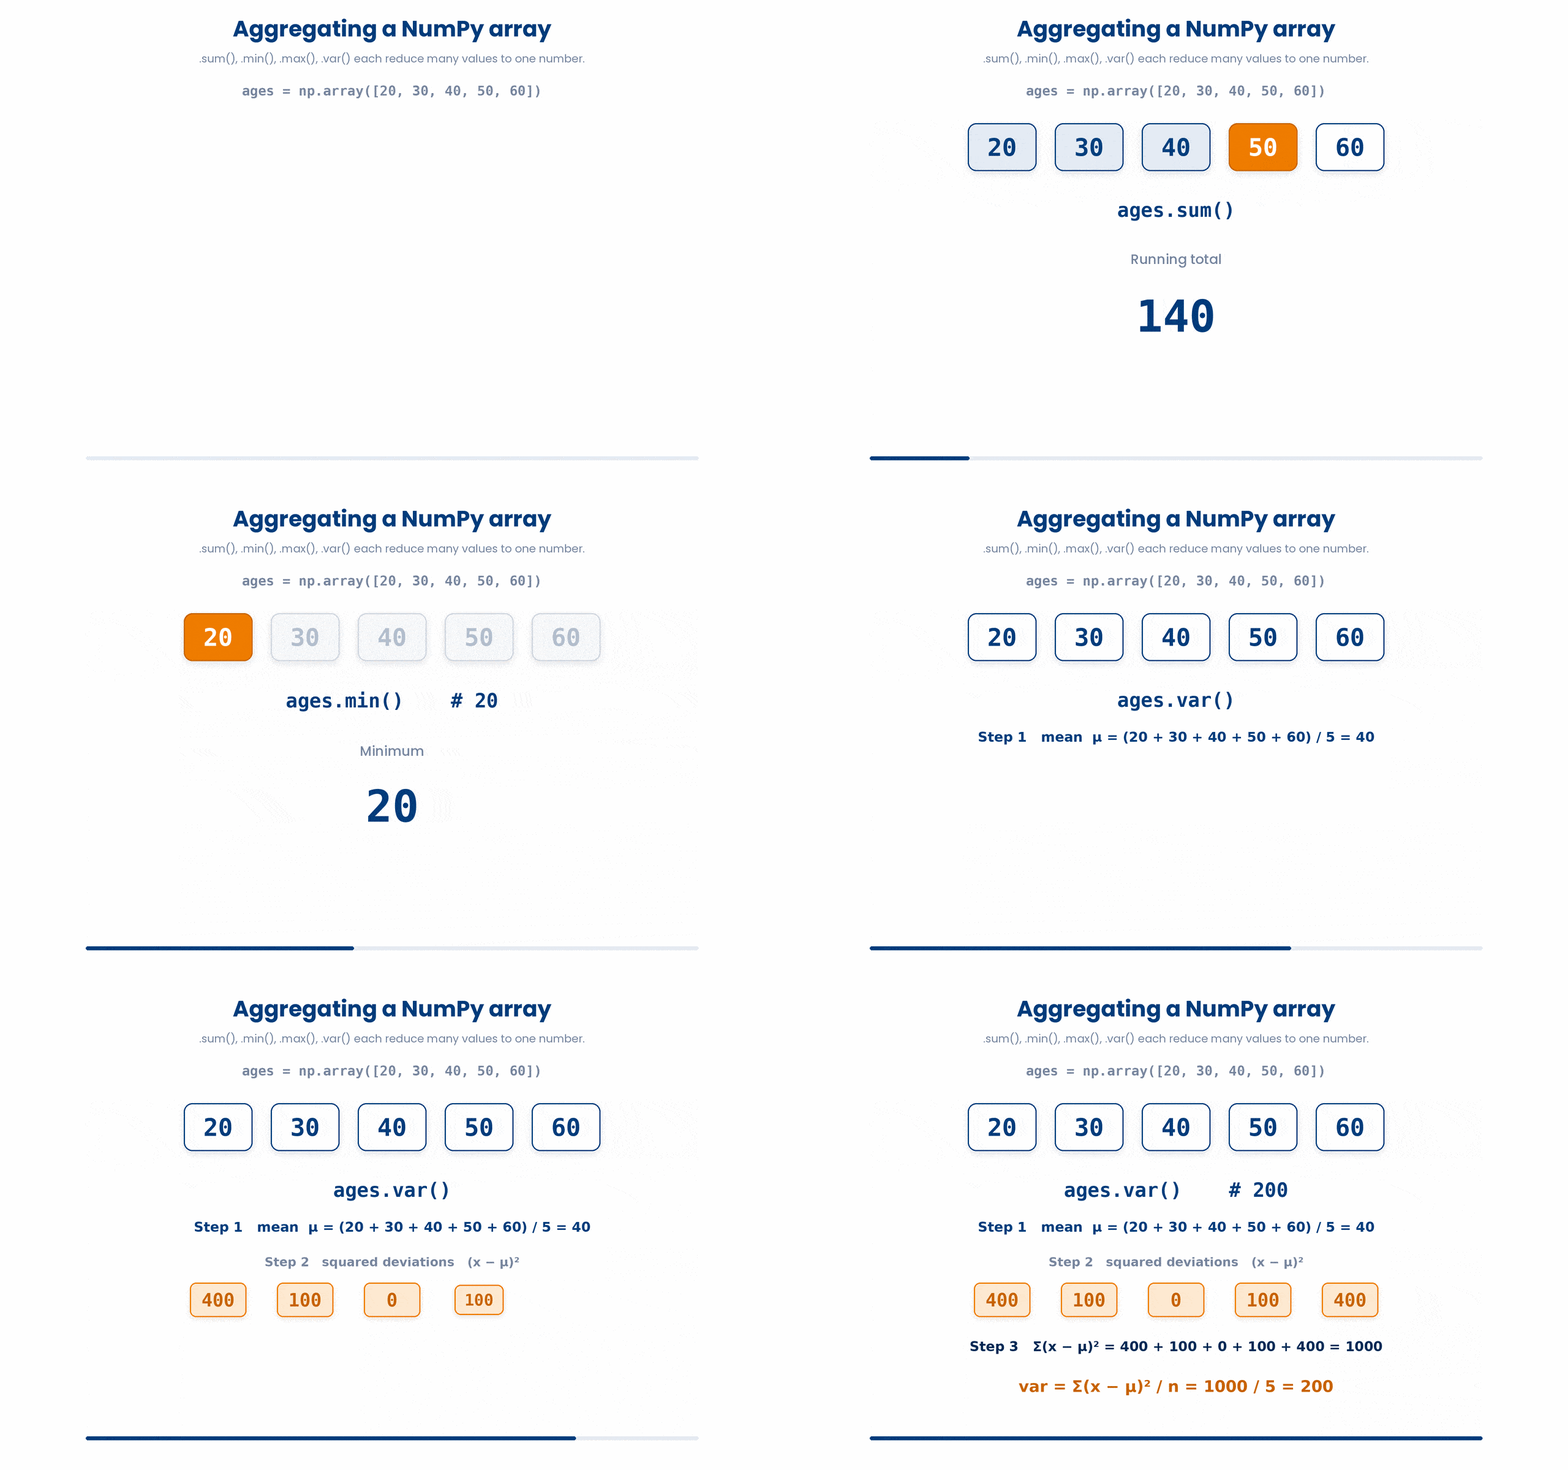
ages.sum()- the sum of every element.ages.min()- the smallest element.ages.max()- the largest element.ages.var()- the variance (standard deviation squared).
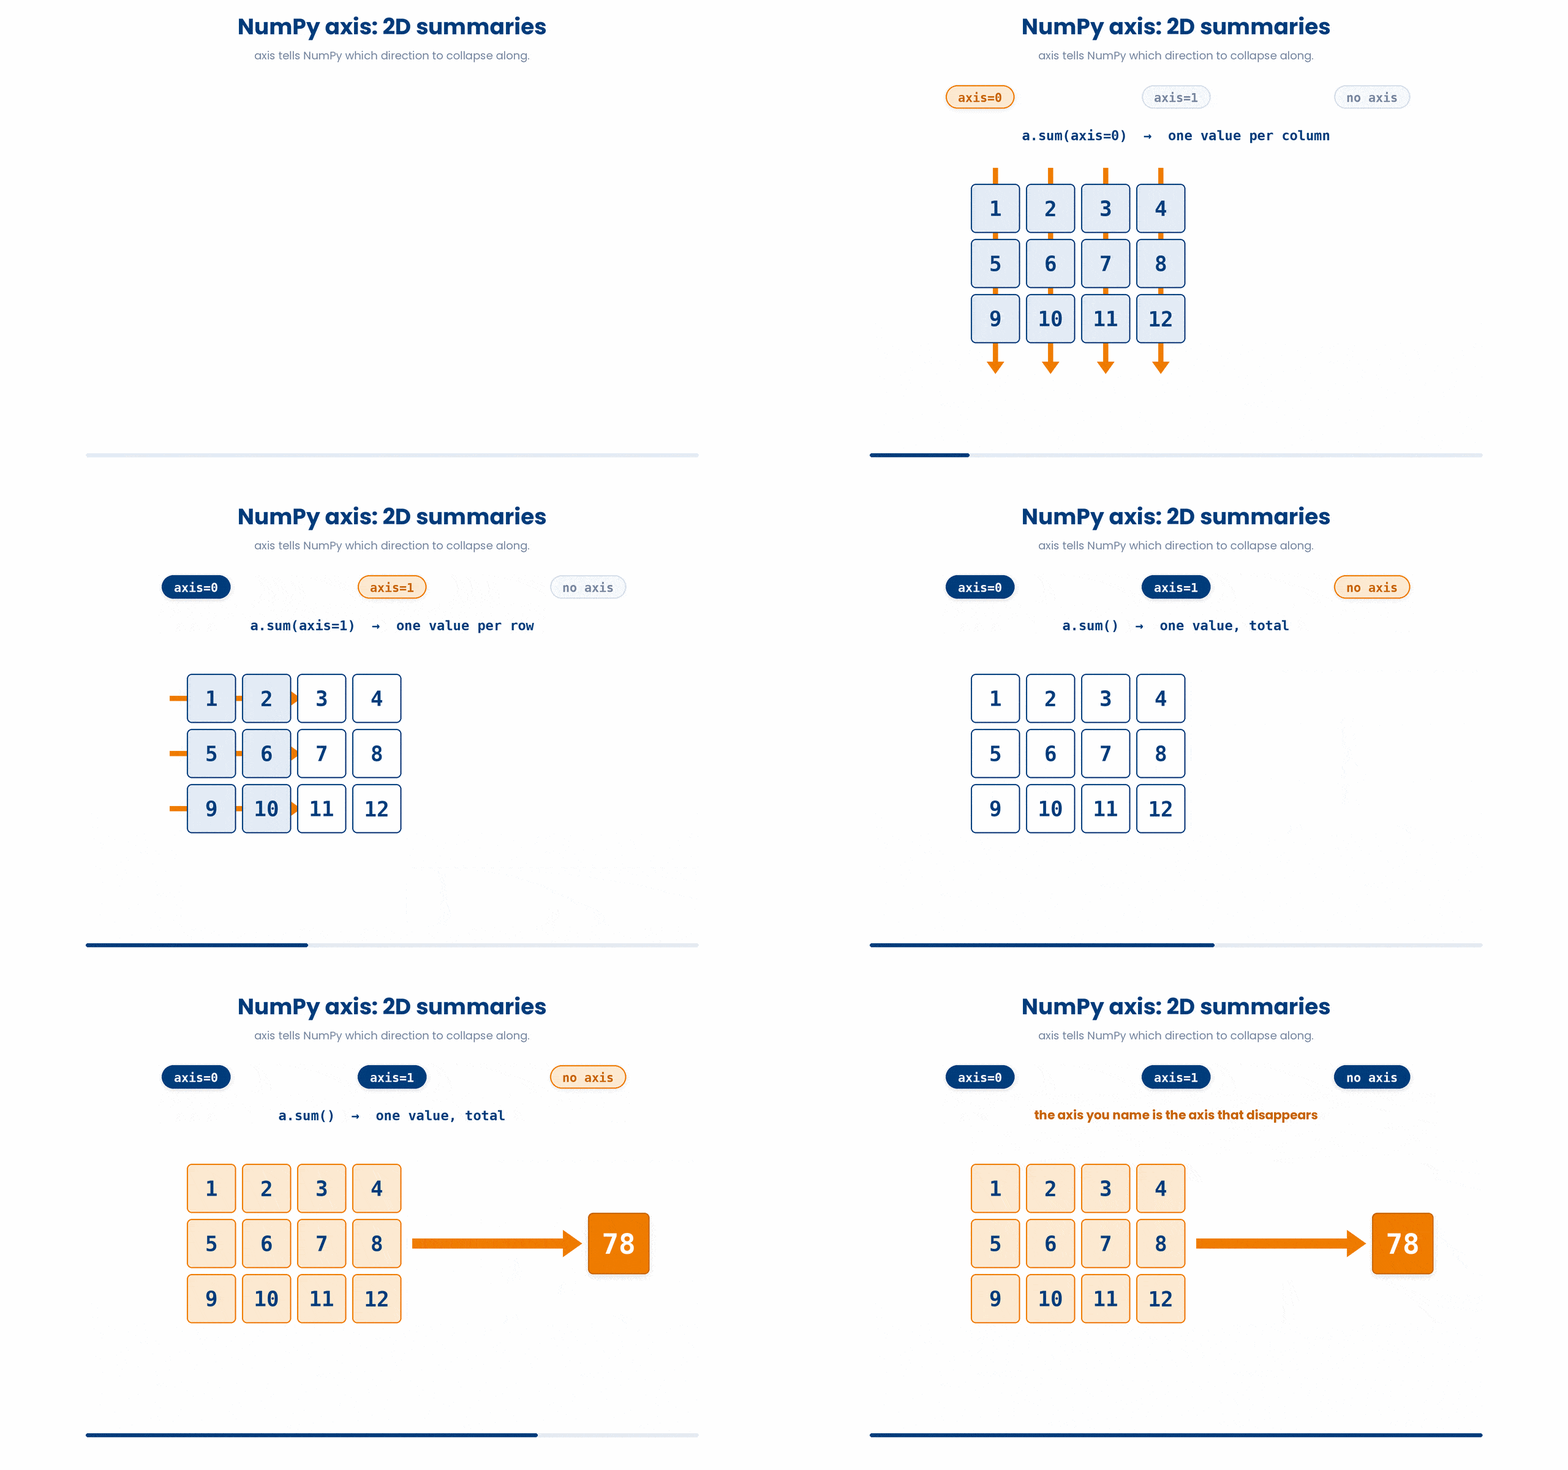
For 2D arrays, all of these summaries take an extra argument called axis that tells NumPy which direction to collapse along. axis=0 collapses each column down to a single number (giving you one summary per column). axis=1 collapses each row (giving you one summary per row). With no axis argument, NumPy summarises the whole array as one number, ignoring rows and columns.
Try this snippet in the Python Scratchpad on the right.
import numpy as np
patients = np.array([
    [54, 72.5, 1.75],
    [61, 68.0, 1.80],
    [47, 80.2, 1.68]
])
print(patients.mean())
print(patients.mean(axis=0))
print(patients.mean(axis=1))To get meaningful summaries, we need to use the axis argument.
- If you call
patients.mean()without any arguments, NumPy returns just one number: the average of all nine values mashed together. Because our columns contain mixed data (ages, weights, and heights), this overall average isn't very useful. - If we run
patients.mean(axis=0), NumPy calculates the mean down the columns, returning three distinct numbers: the mean age, the mean weight, and the mean height of our patients. - If we run
patients.mean(axis=1), NumPy calculates the mean across the rows. This would average Patient 1's age, weight, and height together—which is essentially meaningless here!
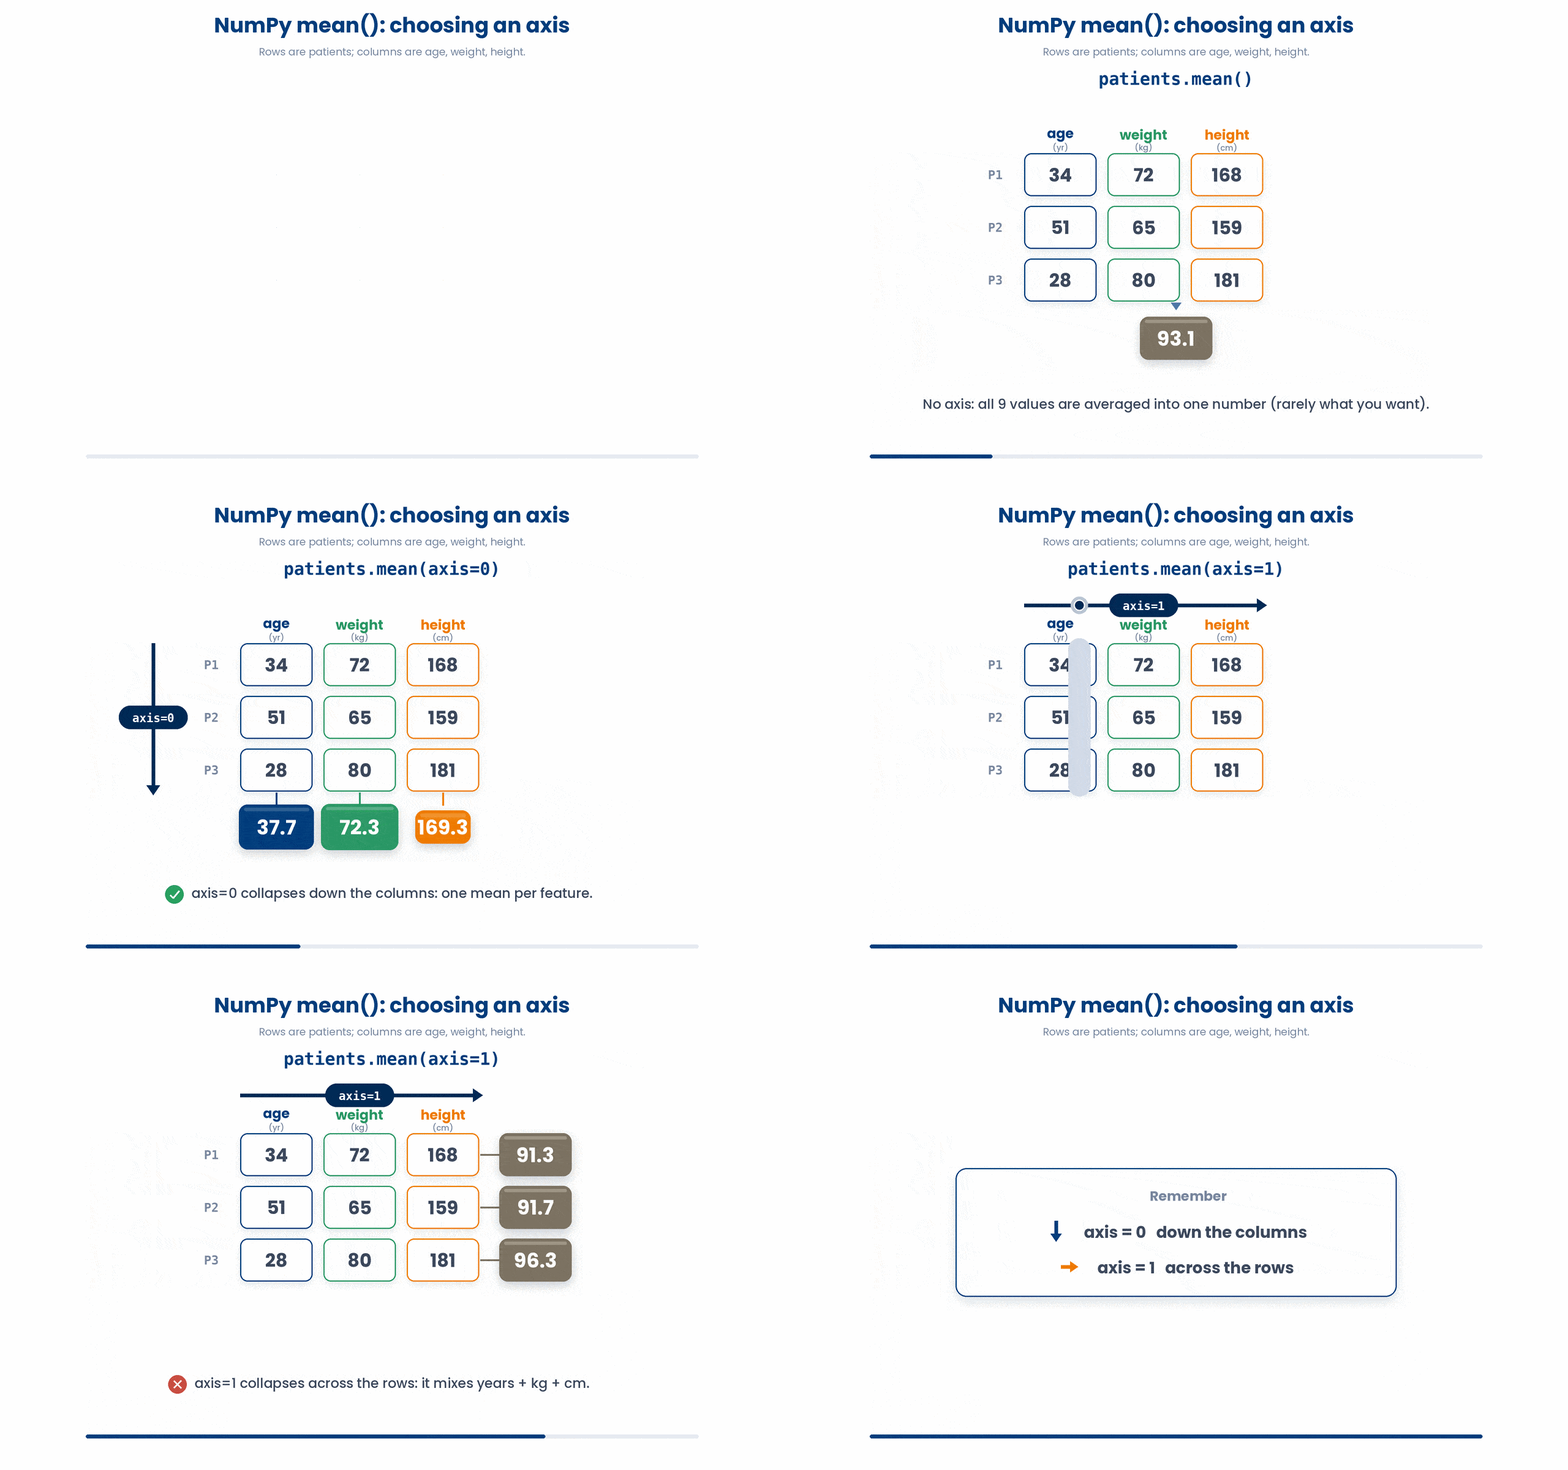
With these methods in hand, you can summarize any dataset in a single line of code, whether you need the whole picture or a clean breakdown by row or column. Just remember the golden rule for 2D arrays: choose your axis deliberately, because the right direction is the difference between a meaningful statistic and a meaningless one.
3.1 argmin and argmax
.min() and .max() tell you what the smallest and largest values are. .argmin() and .argmax() tell you where they live - the position of the minimum or maximum element. On a 2D array these take an axis argument the same way .mean() does.
Try this snippet in the Python Scratchpad on the right.
import numpy as np
bmi = np.array([27.4, 31.1, 24.8, 29.5, 33.2])
print(bmi.max())
print(bmi.argmax())
print(bmi[bmi.argmax()])![.argmax() returns the index where the maximum sits, not the maximum itself, which is why bmi[bmi.argmax()] indexes back to recover the value that .max() reports directly.](GIF_np_argmax_value_vs_position.gif)
3.2 np.unique for counting categories
When a column holds categorical values - clinic names, diagnosis codes, blood types - the first question is usually how many distinct values there are and how often each one appears. np.unique returns the sorted unique values; pass return_counts=True and it returns counts alongside.
Try this snippet in the Python Scratchpad on the right.
import numpy as np
clinics = np.array(["A", "B", "A", "C", "B", "B", "A"])
values, counts = np.unique(clinics, return_counts=True)
print(values)
print(counts)![np.unique with return_counts=True gives back two arrays aligned by position, the sorted distinct values and a parallel count of how many times each occurs, so values[i] and counts[i] describe the same category rather than forming a dictionary.](GIF_np_unique_counts.gif)
3.3 np.percentile and np.quantile
The mean and standard deviation summarise a normal-looking distribution. For skewed data - lengths of stay, costs, lab values - percentiles tell you more. np.percentile(arr, 50) is the median, np.percentile(arr, 95) is the 95th percentile, and you can pass a list to get several at once.
Try this snippet in the Python Scratchpad on the right.
import numpy as np
length_of_stay = np.array([2, 3, 3, 4, 5, 5, 7, 9, 12, 30])
print(np.percentile(length_of_stay, [25, 50, 75]))
print(np.percentile(length_of_stay, 95))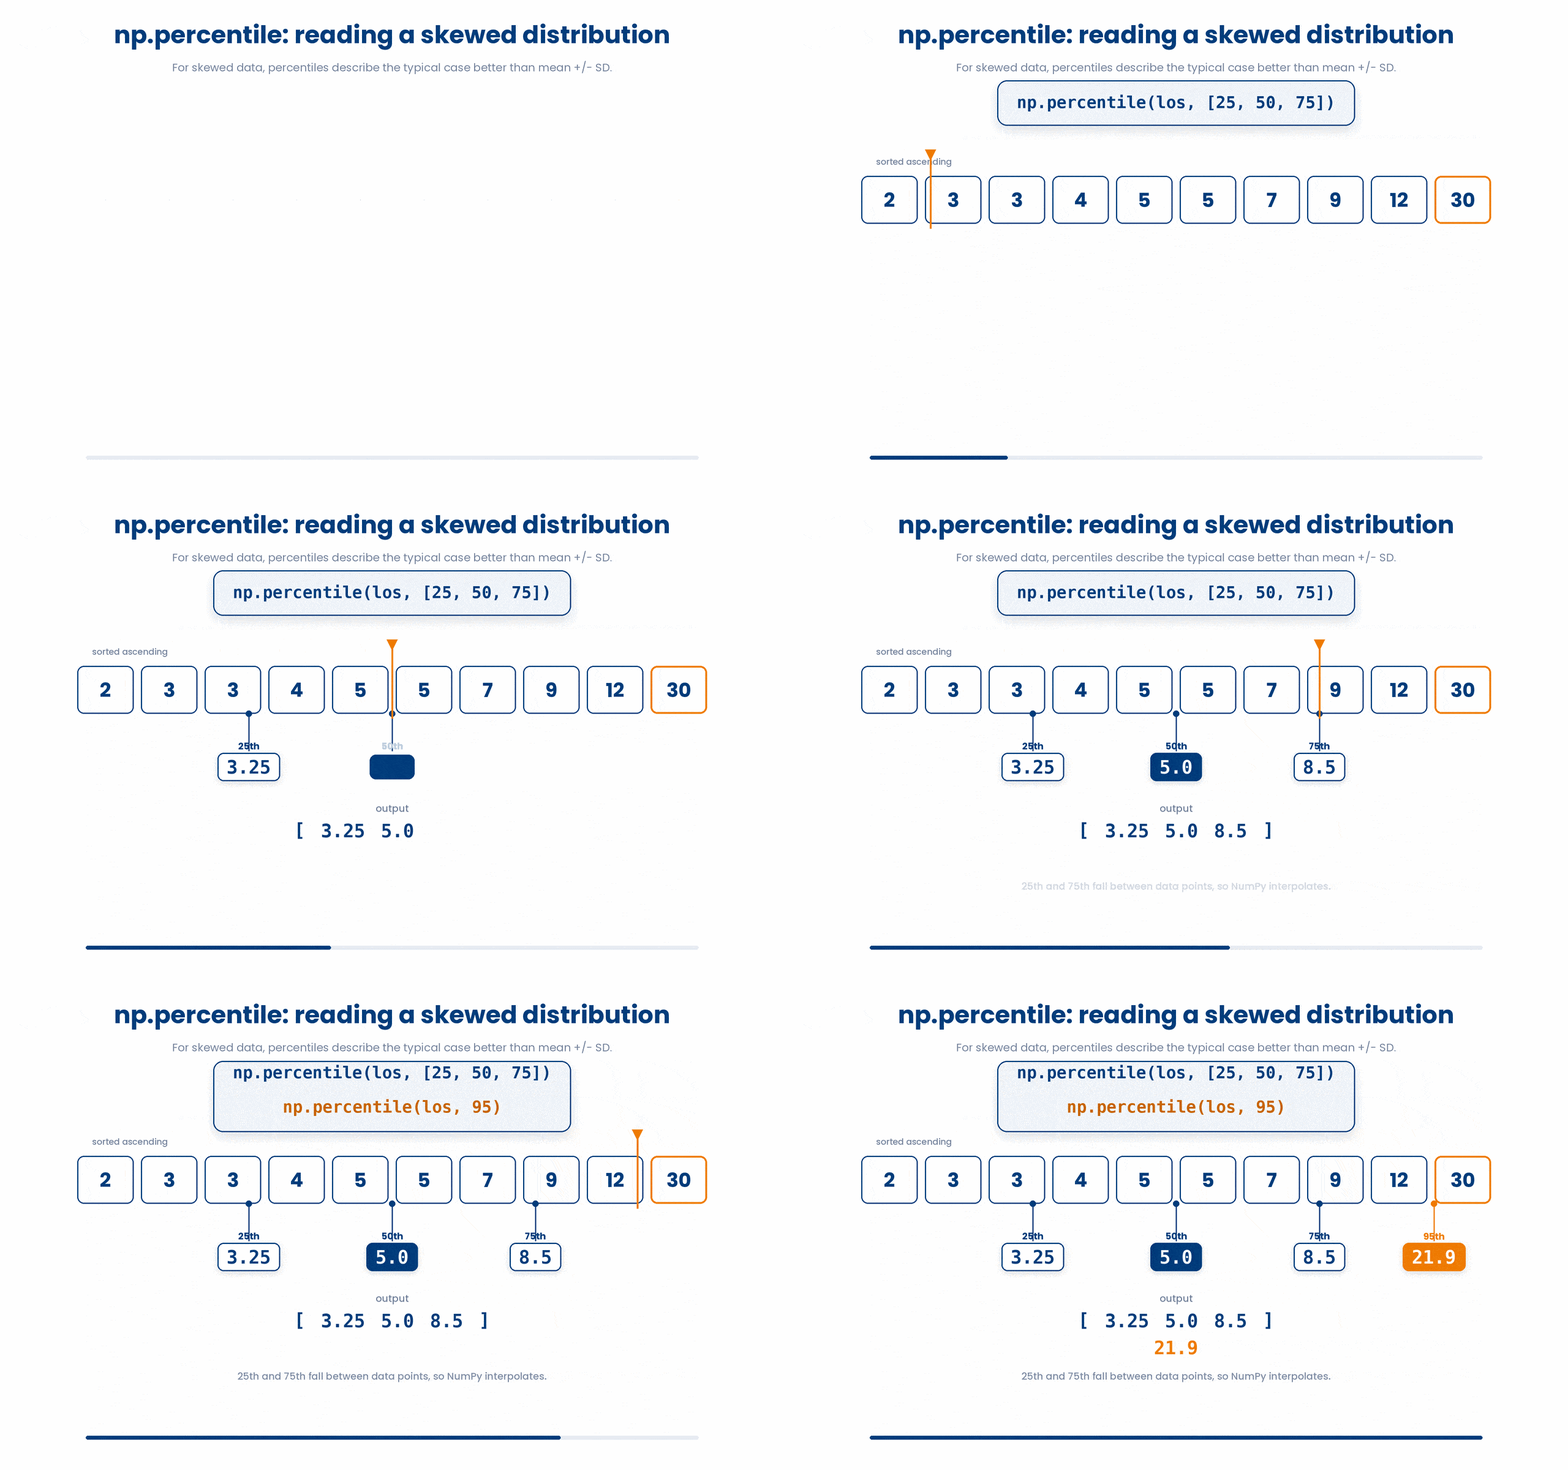
3.4 np.isnan for detecting missing values
NumPy uses np.nan (not-a-number) to mark a missing or undefined value. The catch is that nan == nan is False, so arr == np.nan never finds anything. np.isnan(arr) returns a boolean array - True where the value is missing - which you can then use with the boolean indexing patterns from the previous section.
Try this snippet in the Python Scratchpad on the right.
import numpy as np
values = np.array([54, np.nan, 47, 72, np.nan])
mask = np.isnan(values)
print(mask)
print(values[~mask])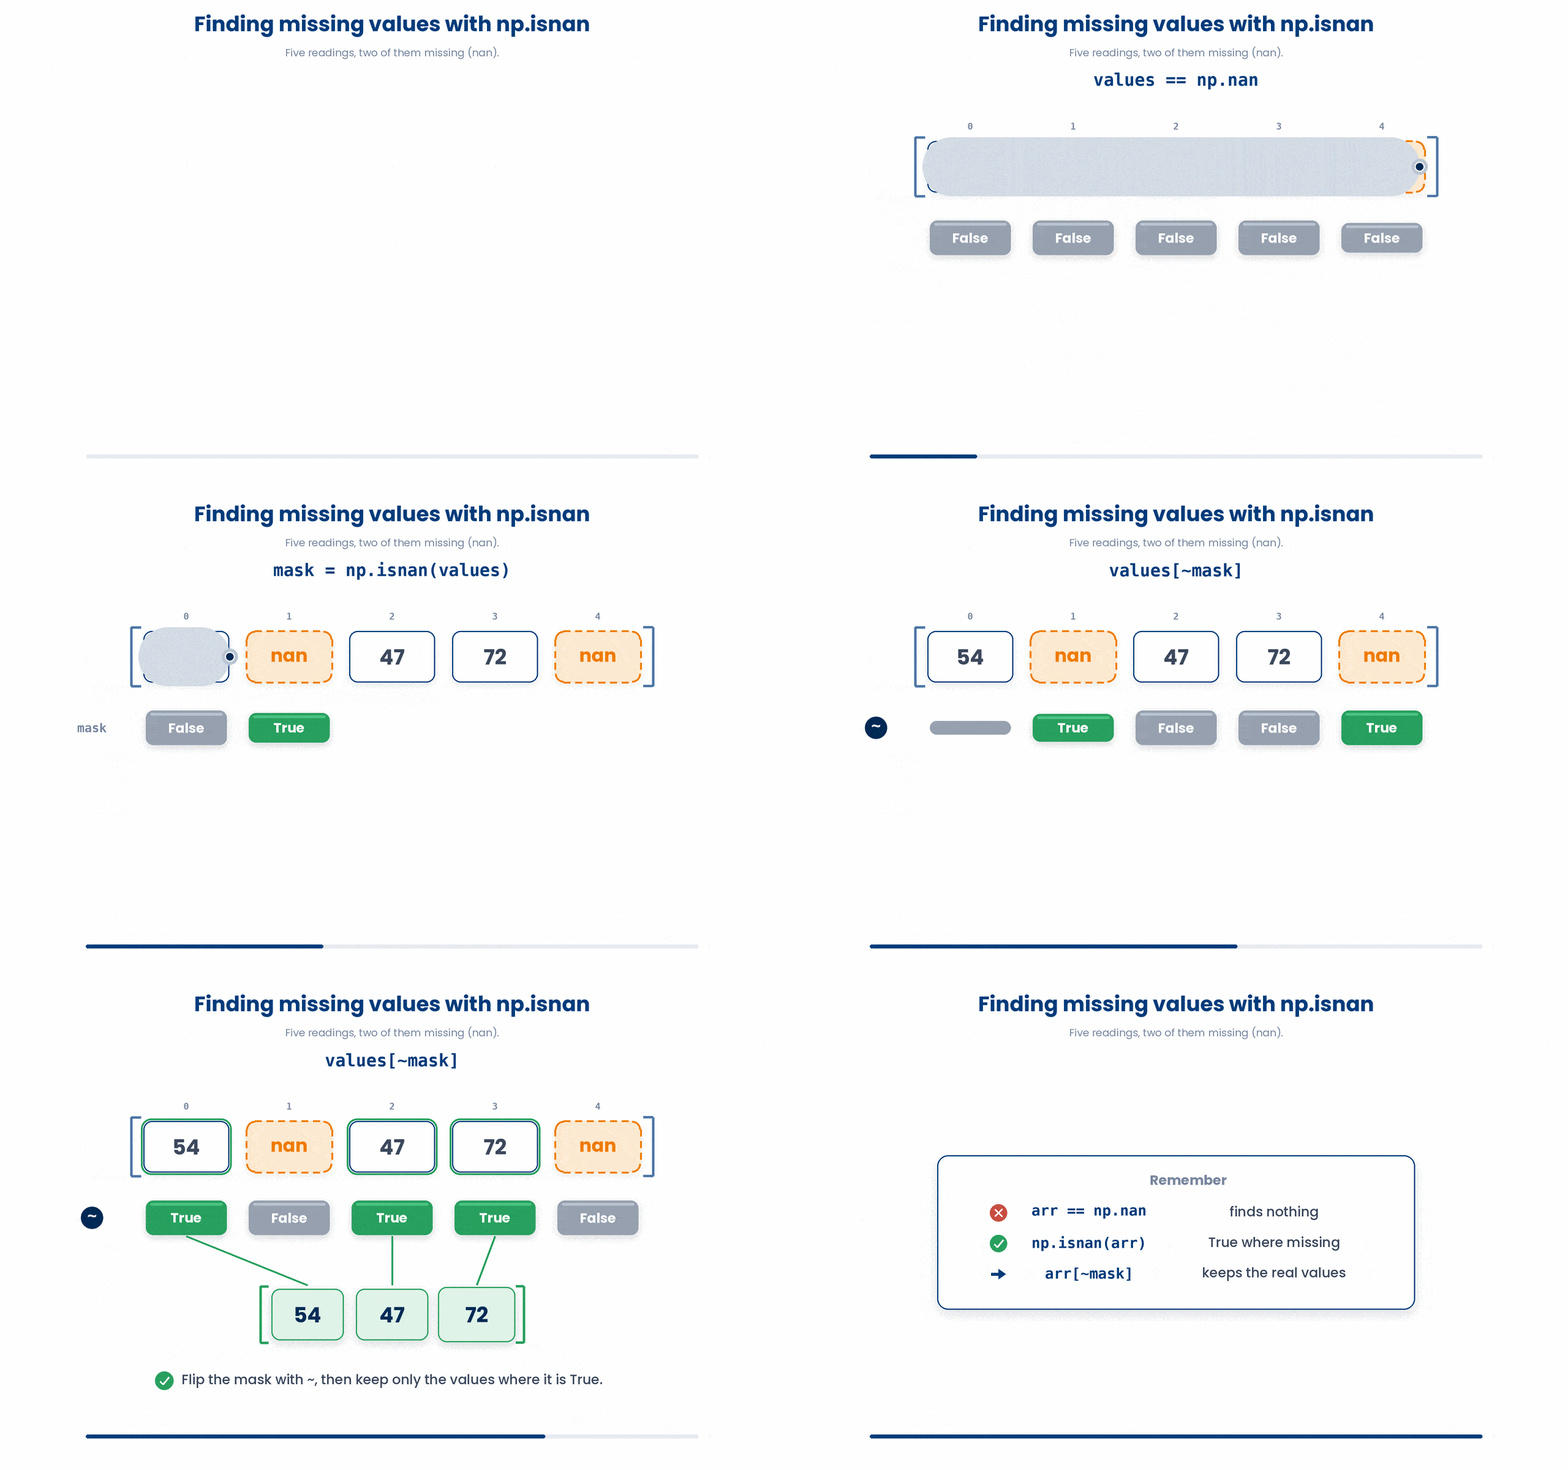
4 Boolean indexing and filtering
So far, we have pulled data out of arrays using positions (like ages[0]). But often, you want to pick out elements based on a condition, like "Give me every age over 65."
In standard Python, this requires writing a for loop. In NumPy, you just write the condition inside the square brackets, and the array does the rest.
When you write ages[ages >= 65], NumPy is actually doing two things at once:
- Step 1: It creates a Boolean Mask. It checks the condition against every item, creating a new array of True and False values.
- Step 2: It applies the Mask. It places that True/False array inside the brackets. NumPy only lets the data at the True positions through.
Try this snippet in the Python Scratchpad on the right.
import numpy as np
ages = np.array([54, 61, 47, 72, 38])
is_senior = ages >= 65
print(is_senior)
print(ages[is_senior])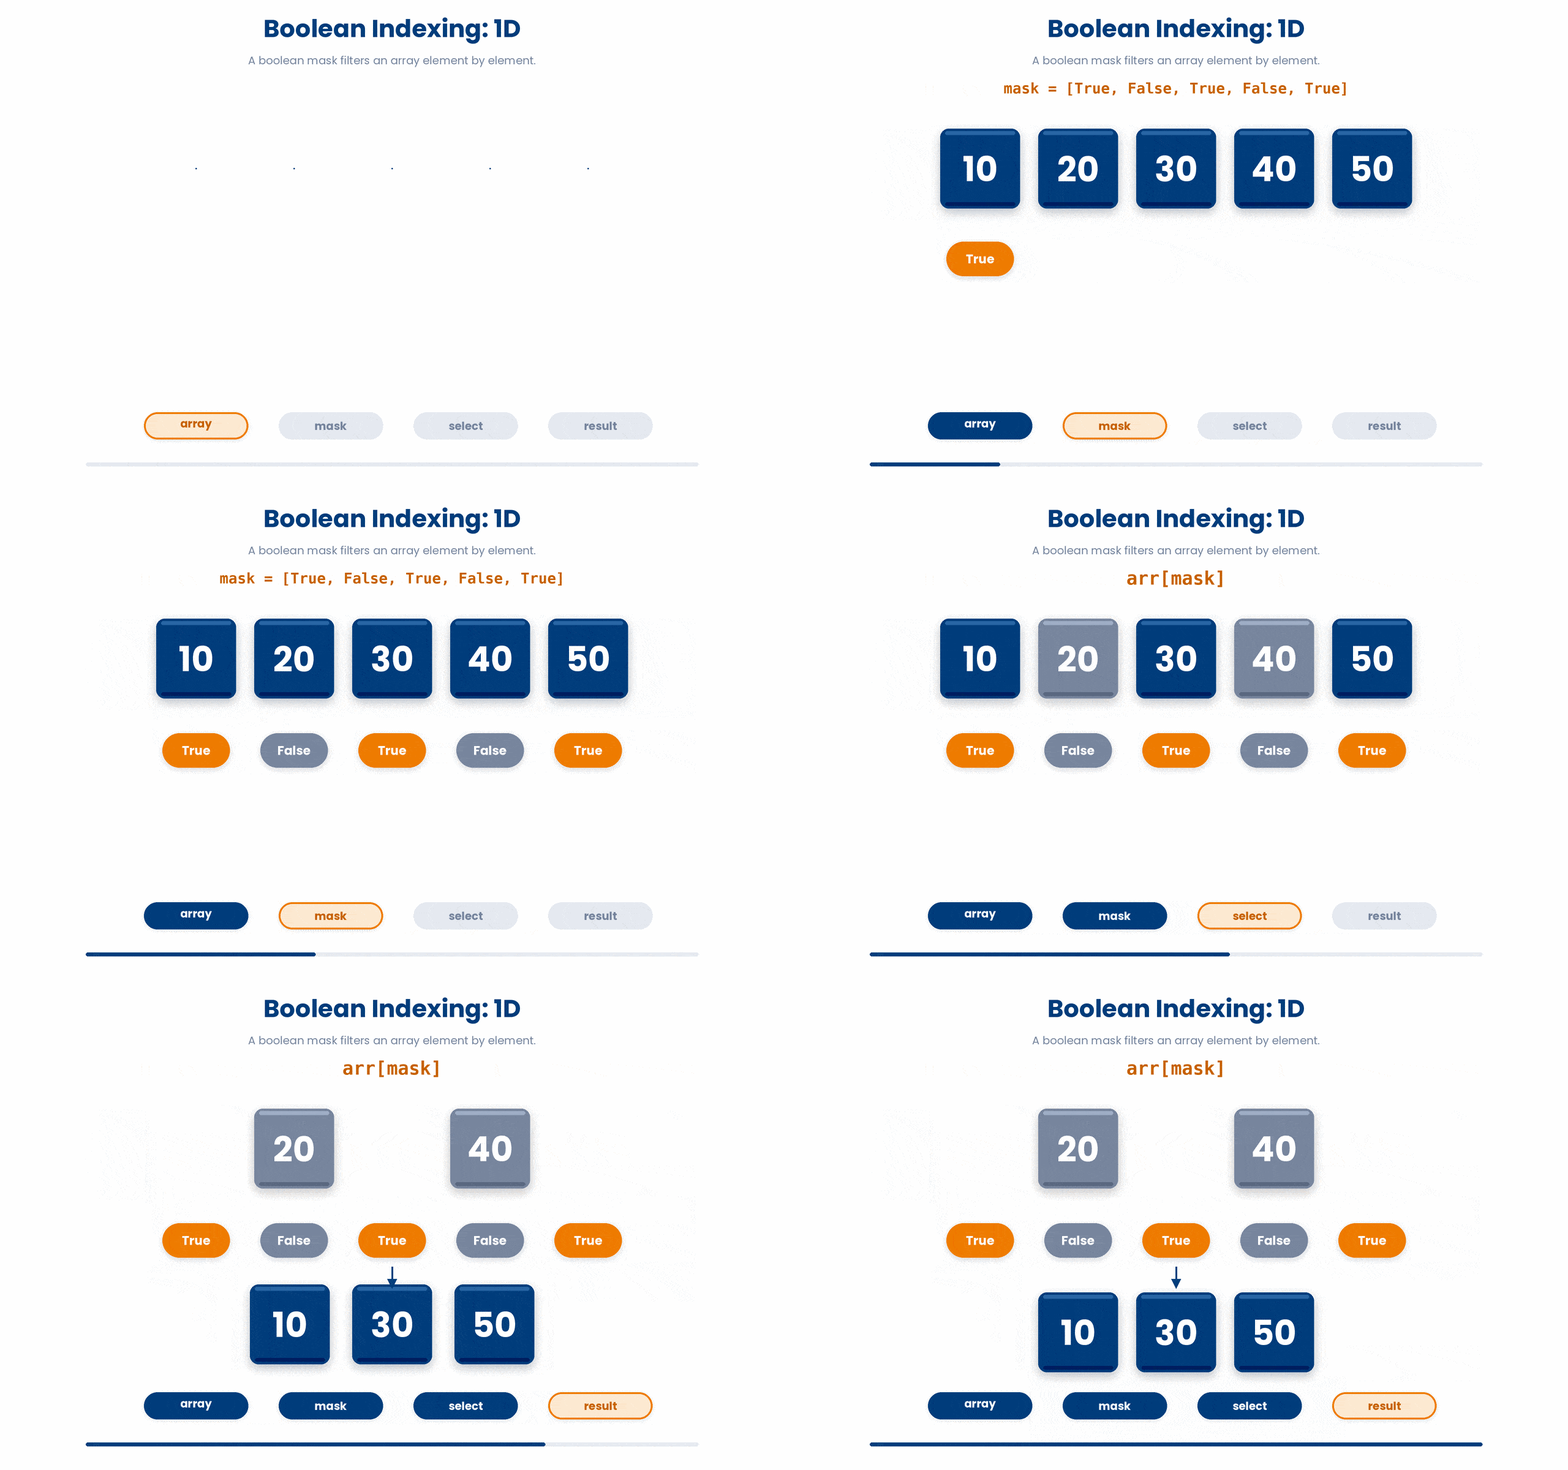
You have already seen >= produce a boolean array, and the same is true of every comparison. <=, ==, and != all work exactly the same elementwise way - compare an array to something and get back an array of True/False, one per element.
Try this snippet in the Python Scratchpad on the right.
import numpy as np
ages = np.array([54, 61, 47, 72, 38])
print(ages <= 60)
print(ages == 47)
print(ages != 47)ages == 47 finds the one patient aged exactly 47; ages != 47 finds everyone else. One exception to remember: comparing against a missing value with == never works, even to check for np.nan itself, because nan == nan is always False. That is exactly why np.isnan() exists, as you saw earlier.
You will frequently want to combine conditions (e.g., finding patients between 50 and 70). You cannot use standard Python words here.
- Use Symbols, not words: Use
&for AND, and|for OR. If you type the wordand, Python will throw an error. - Parentheses are mandatory: You must wrap each individual condition in parentheses
(), or the math order-of-operations will break your code.
Try this snippet in the Python Scratchpad on the right.
import numpy as np
ages = np.array([54, 61, 47, 72, 38])
between = ages[(ages >= 50) & (ages < 70)]
print(between)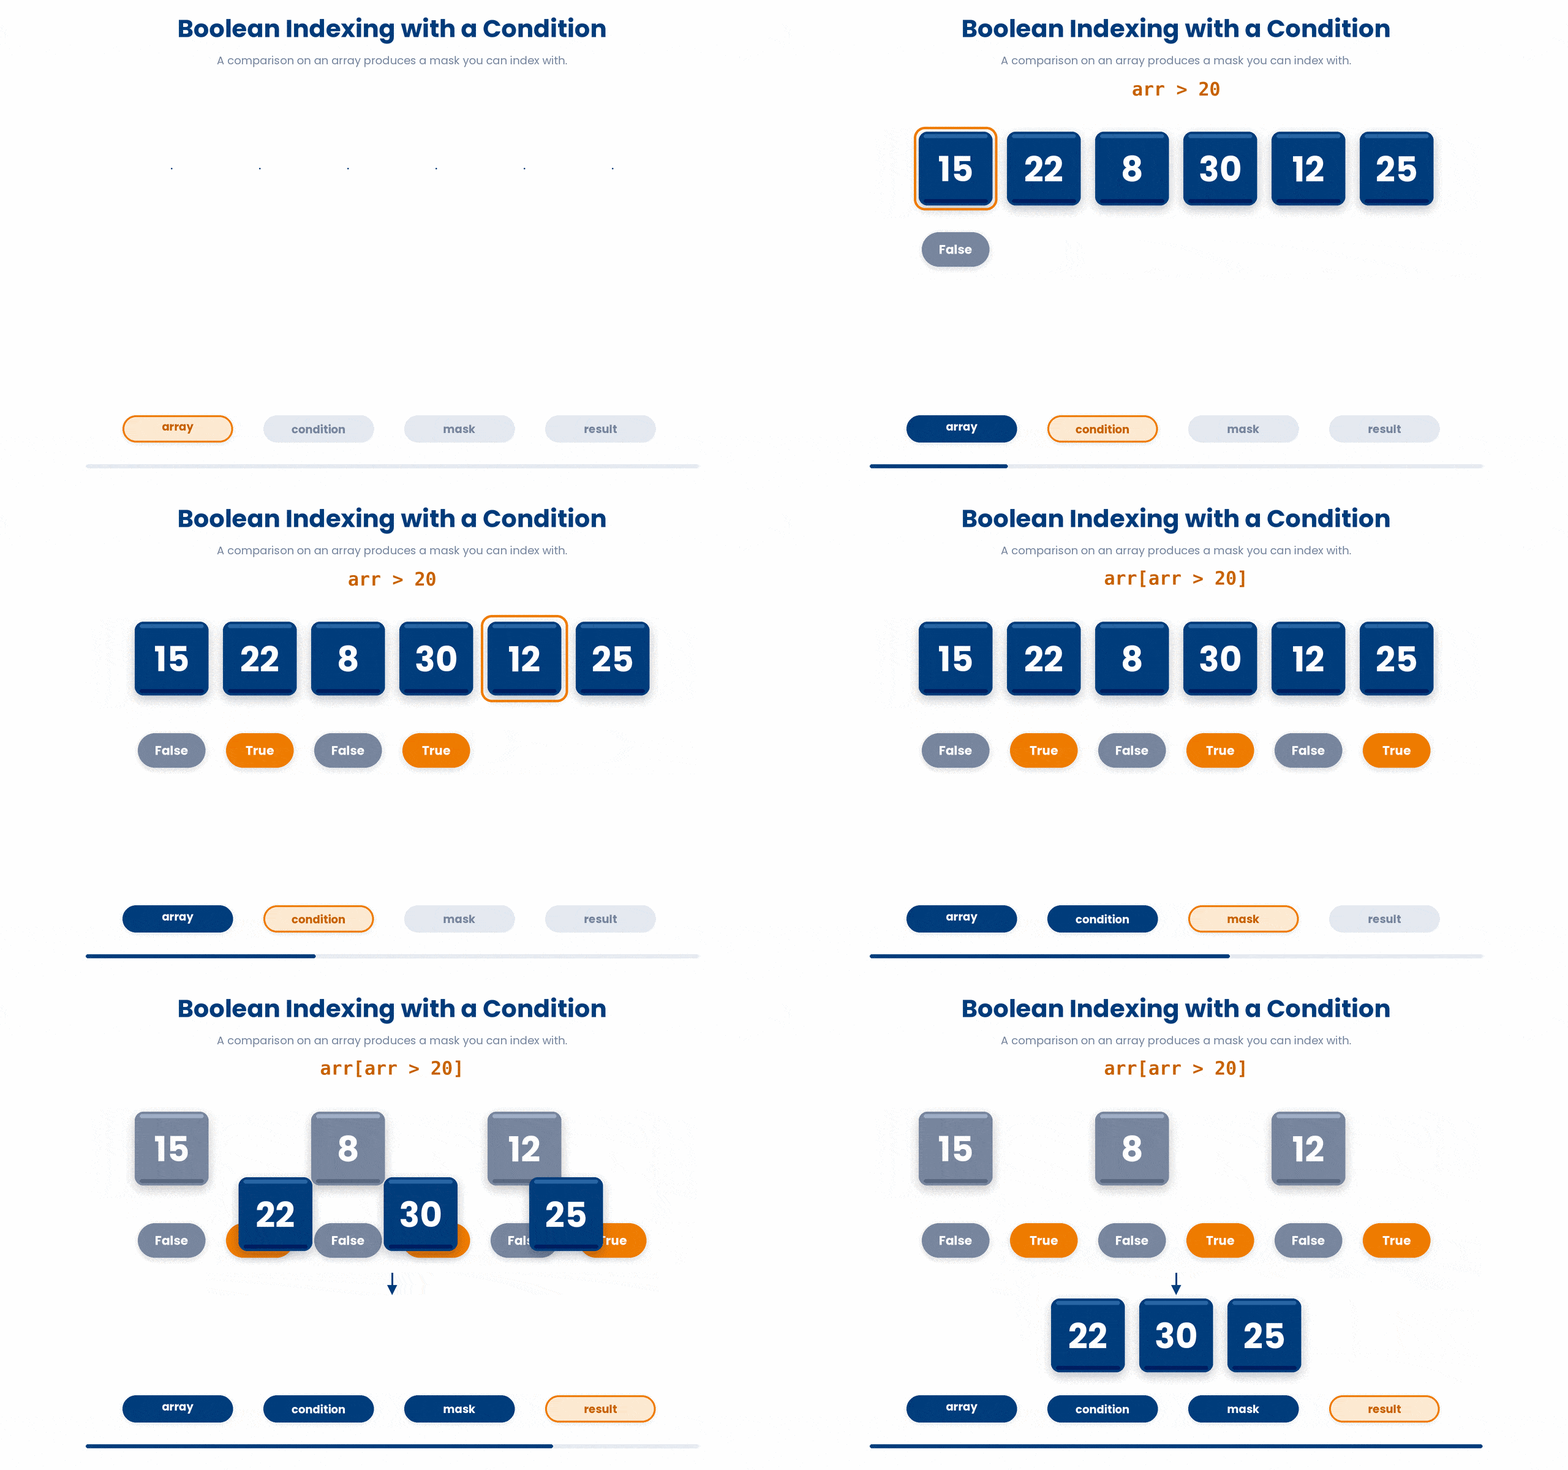
The exact same trick works for 2D data (like tables). A common workflow is checking a condition in one column, and using it to filter all the rows.
Try this snippet in the Python Scratchpad on the right.
import numpy as np
patients = np.array([
    [54, 72.5, 1.75],
    [61, 68.0, 1.80],
    [47, 80.2, 1.68]
])
ages = patients[:, 0]
print(patients[ages >= 50, :])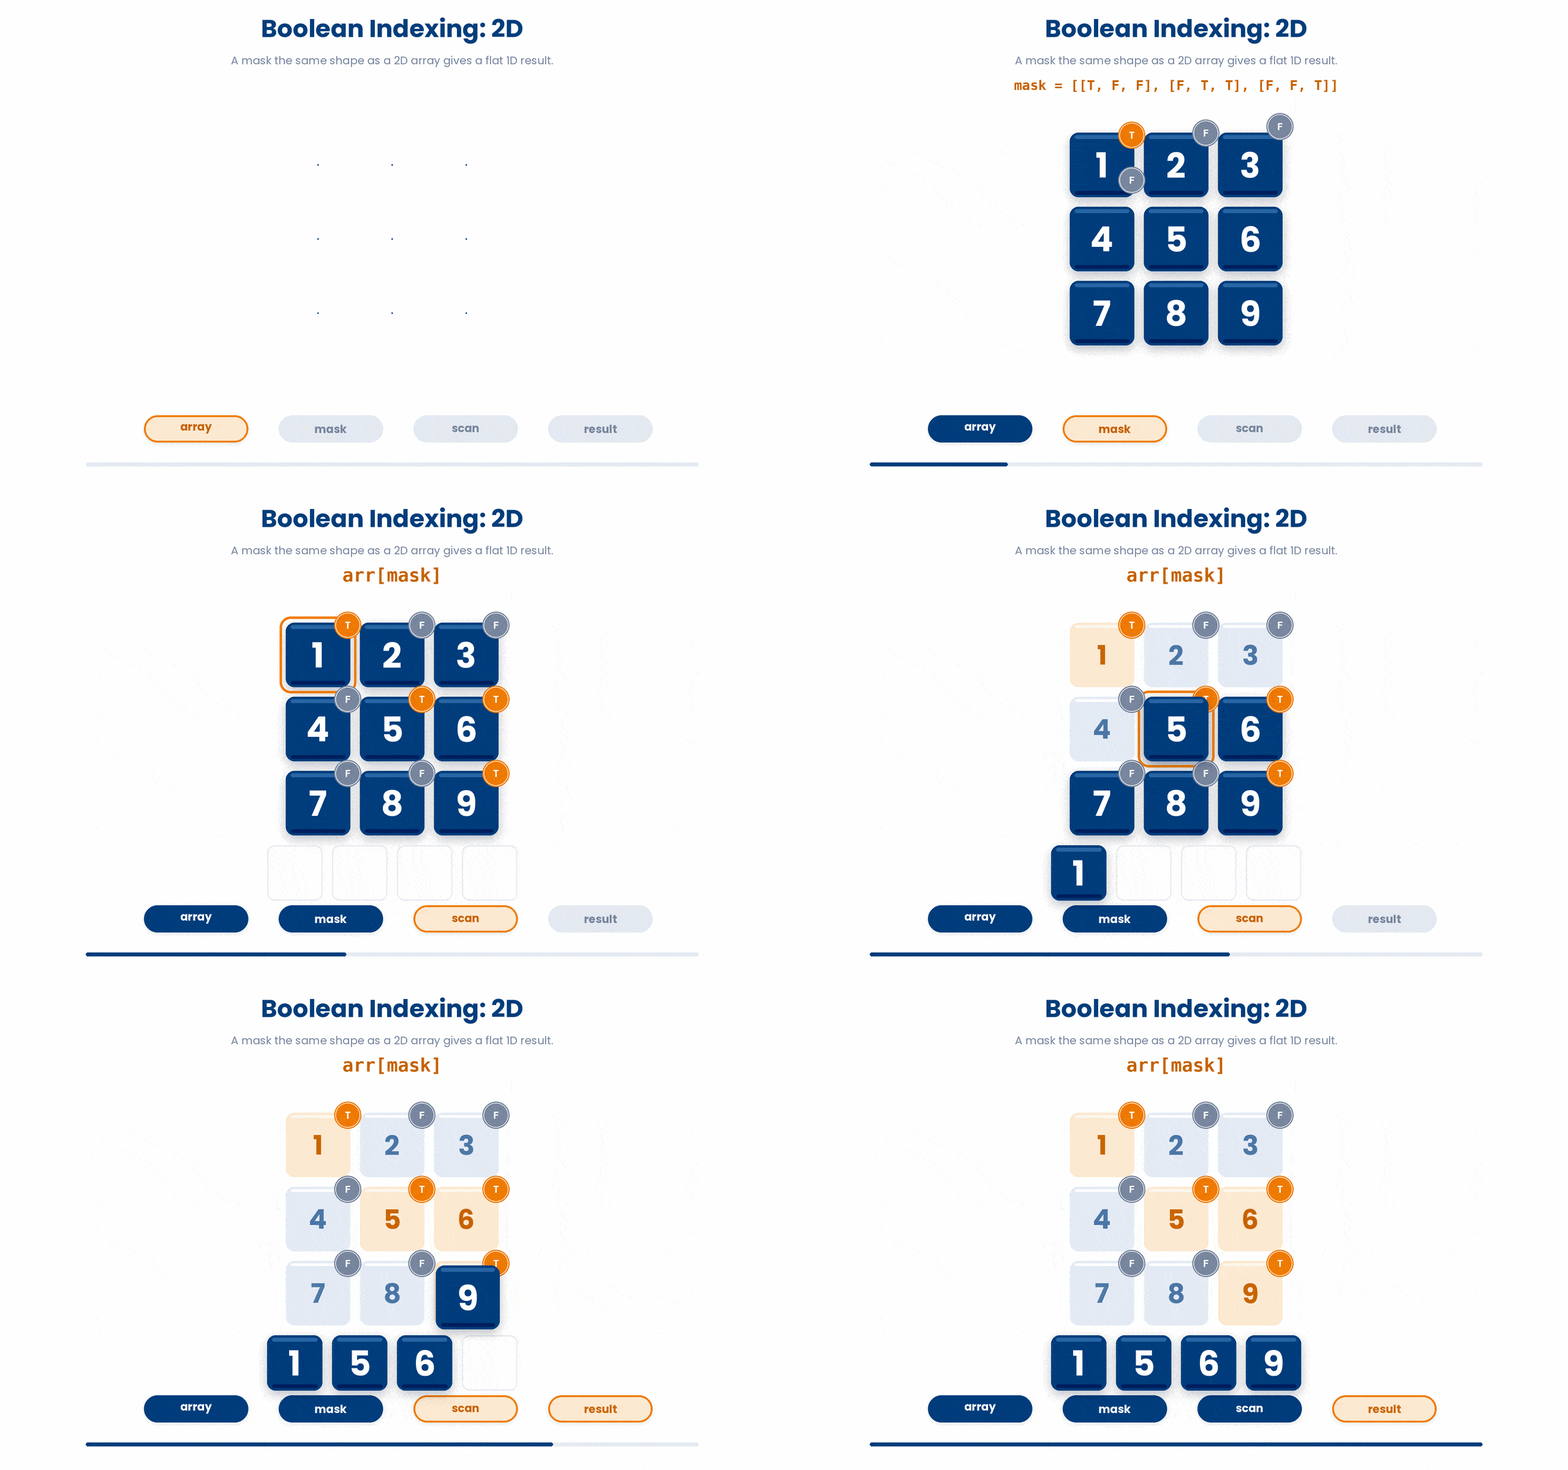
5 Conditional transforms with np.where
Boolean indexing is great for filtering data. You can keep what you want and drop the rest. But what if you want to keep your array the exact same size, and just change specific values based on a condition?
For example, you might want to replace negative values with zero, or label everyone over 65 as a "senior".
Try this snippet in the Python Scratchpad on the right.
import numpy as np
ages = np.array([54, 61, 47, 72, 38])
labels = np.where(ages >= 65, "senior", "adult")
print(labels)
NumPy checks the condition array element by element. If it sees True, it uses the first value ("senior"). If it sees False, it uses the second value ("adult").
The True/False slots don't have to be simple text or numbers. They can be entire arrays oreven the original array itself.
Want to double every dose over 10, but leave the others alone? Pass doses * 2 as the True value, and the original doses as the False value:
Try this snippet in the Python Scratchpad on the right.
import numpy as np
doses = np.array([5, 12, 7, 20, 3])
boosted = np.where(doses > 10, doses * 2, doses)
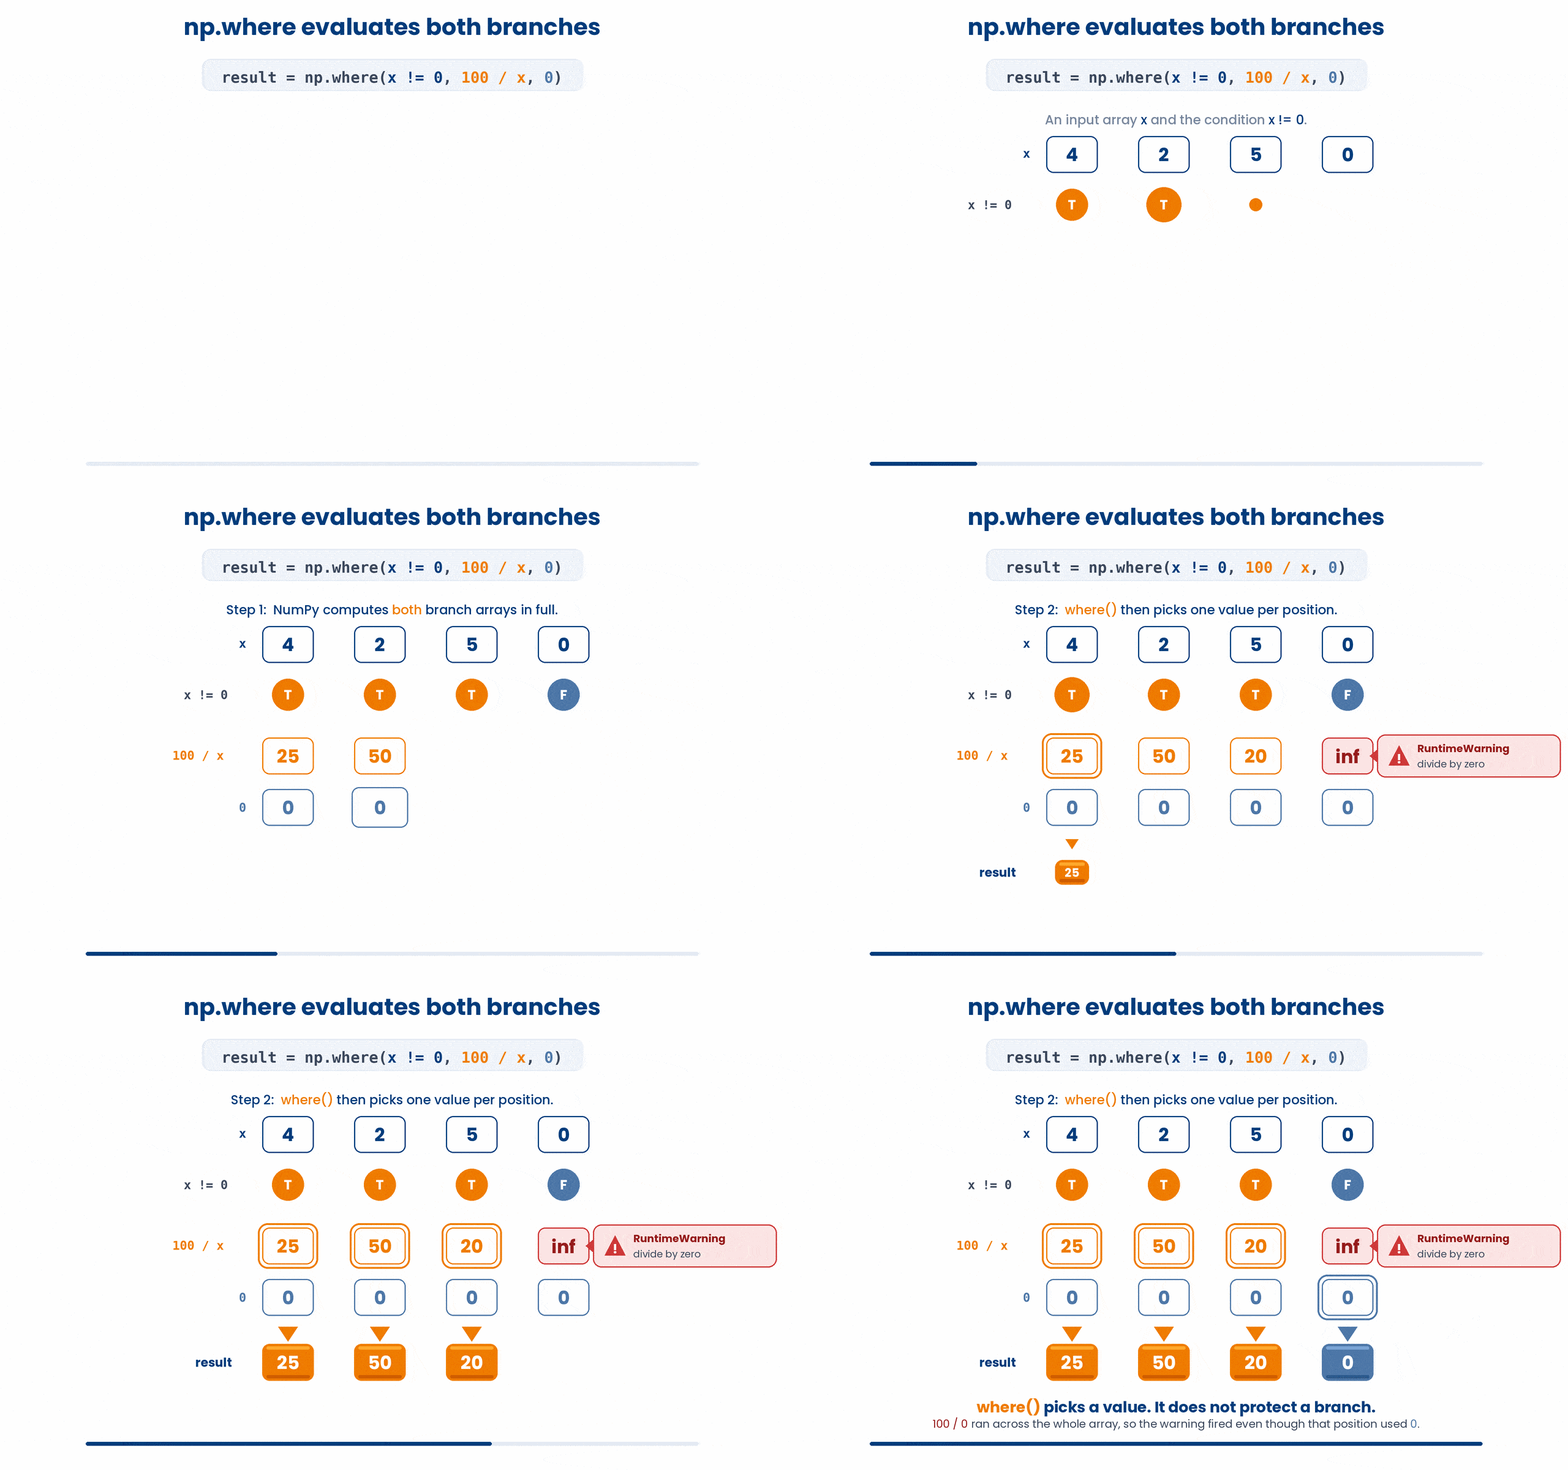
print(boosted)There is one subtle behavior that catches many beginners off guard. np.where computes both the True and False outcomes completely before making its selections.
If your True calculation involves something unsafe—like dividing by zero—Python will still throw a warning or error, even if np.where ends up picking the False path for those specific elements. np.where acts as an element picker, not a protective shield from unsafe math.
When should you reach for np.where versus boolean indexing?
The rule of thumb is whether the result needs to be the same size as the input or smaller.
If you want to keep only some elements, use boolean indexing - ages[ages >= 65].
If you want a result of the same length, with the values transformed based on a condition, use np.where - np.where(ages >= 65, "senior", "adult"). Trying to do the first with np.where is awkward; trying to do the second with boolean indexing forces you back into a loop.
Here is a recipe that uses .mean() and .std() together, and it is one of the most common preprocessing steps before feeding data into a machine-learning model: z = (values - values.mean()) / values.std(). This is called standardising, or the Z-score. Subtracting the mean centres the data on 0; dividing by the standard deviation rescales it into units of standard deviations instead of the original unit. That is what lets you put two completely different measurements - age in years, glucose in mmol/L - on one comparable scale. A z of 2 always means "two standard deviations above average," whatever the original unit was.
Try this snippet in the Python Scratchpad on the right.
import numpy as np
glucose = np.array([4.5, 5.1, 4.9, 9.8, 5.3, 5.0, 4.7])
z_scores = (glucose - glucose.mean()) / glucose.std()
print(z_scores)Six of these seven readings sit less than one standard deviation from the mean; the fourth, 9.8, comes out at roughly 2.4 - more than two standard deviations above average, a genuine outlier on this scale even though the raw numbers are just in mmol/L. Once you have z-scores, flagging outliers is one line with np.where, which you already know.
Try this snippet in the Python Scratchpad on the right.
import numpy as np
glucose = np.array([4.5, 5.1, 4.9, 9.8, 5.3, 5.0, 4.7])
z_scores = (glucose - glucose.mean()) / glucose.std()
outliers = np.where(np.abs(z_scores) >= 2, 1, 0)
print(z_scores)
print(outliers)np.abs(z_scores) >= 2 is True only for that fourth reading, so np.where labels it 1 and every other reading 0 - a ready-made outlier flag you could store as a new column right beside your data.
6 Putting it together
In real code, the five ideas across the two parts of this NumPy module show up together. You build an array from your data, summarise it with one-line statistics, filter out the values you do not want, and transform the rest with np.where. The short worked example below puts that pipeline into a single block of code on a small patient array.
Work through this example in three stages. You unlock each stage only after the tutor confirms the previous one. Each stage removes more of the scaffolding — by the end you are writing it yourself.
Problem: You have a list of patient ages: [54, 61, 47, 72, 38, 65, 51]. Load it into a NumPy array, print the mean and standard deviation rounded to one decimal place, keep only the ages of 50 or above, and finally produce a label of "senior" or "adult" for each of the original ages with np.where.
import numpy as np
ages = np.array([54, 61, 47, 72, 38, 65, 51])
print(f"Mean: {ages.mean():.1f}")
print(f"SD: {ages.std(ddof=1):.1f}")
print(ages[ages >= 50])
labels = np.where(ages >= 65, "senior", "adult")
print(labels)- Import numpy under its conventional alias np and turn the list of ages into an array so the rest of the work is vectorised.
- Use ages.mean() and ages.std(ddof=1) for the summary, with an f-string :.1f to format each number to one decimal place; ddof=1 gives the sample standard deviation.
- Filter the array with the boolean condition ages >= 50 - the result is a new, smaller array of the kept values.
- Use np.where to build a label array the same length as ages, putting 'senior' where the condition is True and 'adult' everywhere else.
The same solution with key parts replaced by ???.
Fill in every ??? so the code matches the reference,
then ask the tutor to check it.
Your turn: A new list of patient weights in kilograms has arrived: [72.5, 68.0, 80.2, 65.4, 90.1]. Load it into an array, print the mean rounded to one decimal place with the label 'Mean weight: ', keep only the weights at or above 70, and label each original weight as either 'overweight' (>= 80) or 'normal' with np.where. Print the labels.
All the lines you need are in the Line bank on the left — some may be distractors you should leave behind. Drag the lines you need into the Your solution column on the right, in the correct order, then click Check.
Task: Build a NumPy array from a list of ages, then on three further lines: print the mean, print the slice of ages that are 50 or above, and print a label array that says 'senior' for ages 65 or above and 'adult' otherwise.
print(ages[ages >= 50])print(np.mean)print(np.where(ages >= 65, "senior", "adult"))import numpy as npages = np.array([54, 61, 47, 72, 38])ages = [54, 61, 47, 72, 38]print(ages.mean())print(np.where(ages >= 65) = "senior")print(ages[ages >= 50 and ages < 70])
- Drop lines here, in order.
Generating a reflection question for you…
7 Check your understanding
You have reached the end of the module. Try the same questions again — your answers here, paired with your pre-test answers, are how we measure what the module taught you. Answer every question and confidence rating, then click Submit and see results to view your score.
ages is a NumPy array. Which of these raises an error because the method does not exist?
patients is a 2D array with one row per patient and columns age, weight, height. Which call returns the mean age, mean weight, and mean height (one value per column)?
You write ages[ages >= 50 and ages < 70] and Python raises a ValueError. What is the fix?
You want a new array the same length as ages, where each element is "senior" or "adult" depending on whether the age is at least 65. Which call does this?
In np.where(mask, a / b, a) some entries of b are 0, and Python warns about dividing by zero even for elements that take the False branch. Why?
bmi is a NumPy array. What does bmi.argmax() return?
values contains some np.nan entries. Why does values == np.nan fail to find them?
ages = np.array([54, 61, 47, 72, 38]). What does ages[ages >= 60] return?
I can compute the mean, median, and standard deviation of a 1D array, and use the axis argument to summarise a 2D array down its rows or columns.
I can filter an array with a boolean condition, combine two conditions with the symbol & or |, and use np.where to build a new array of transformed values.
8 Your results
Here is how your post-test answers compare with your pre-test answers. The pre/post pairing is the most reliable way to see what this module actually taught you.
Submit the post-test to see your results.
What is the one thing from this module that is still unclear to you?