

1 Introduction
A paper on a new blood test says the test was judged by this formula:
If that line looks like a wall, this lesson is for you. The formula says something simple: add up the value for every patient, then divide by the number of patients. That is the mean. You already know how to do it. You only need to learn how it is written.
Mathematical notation is a kind of shorthand. Each symbol stands for a few plain words. When you can swap the symbols back into words, a formula becomes a sentence.
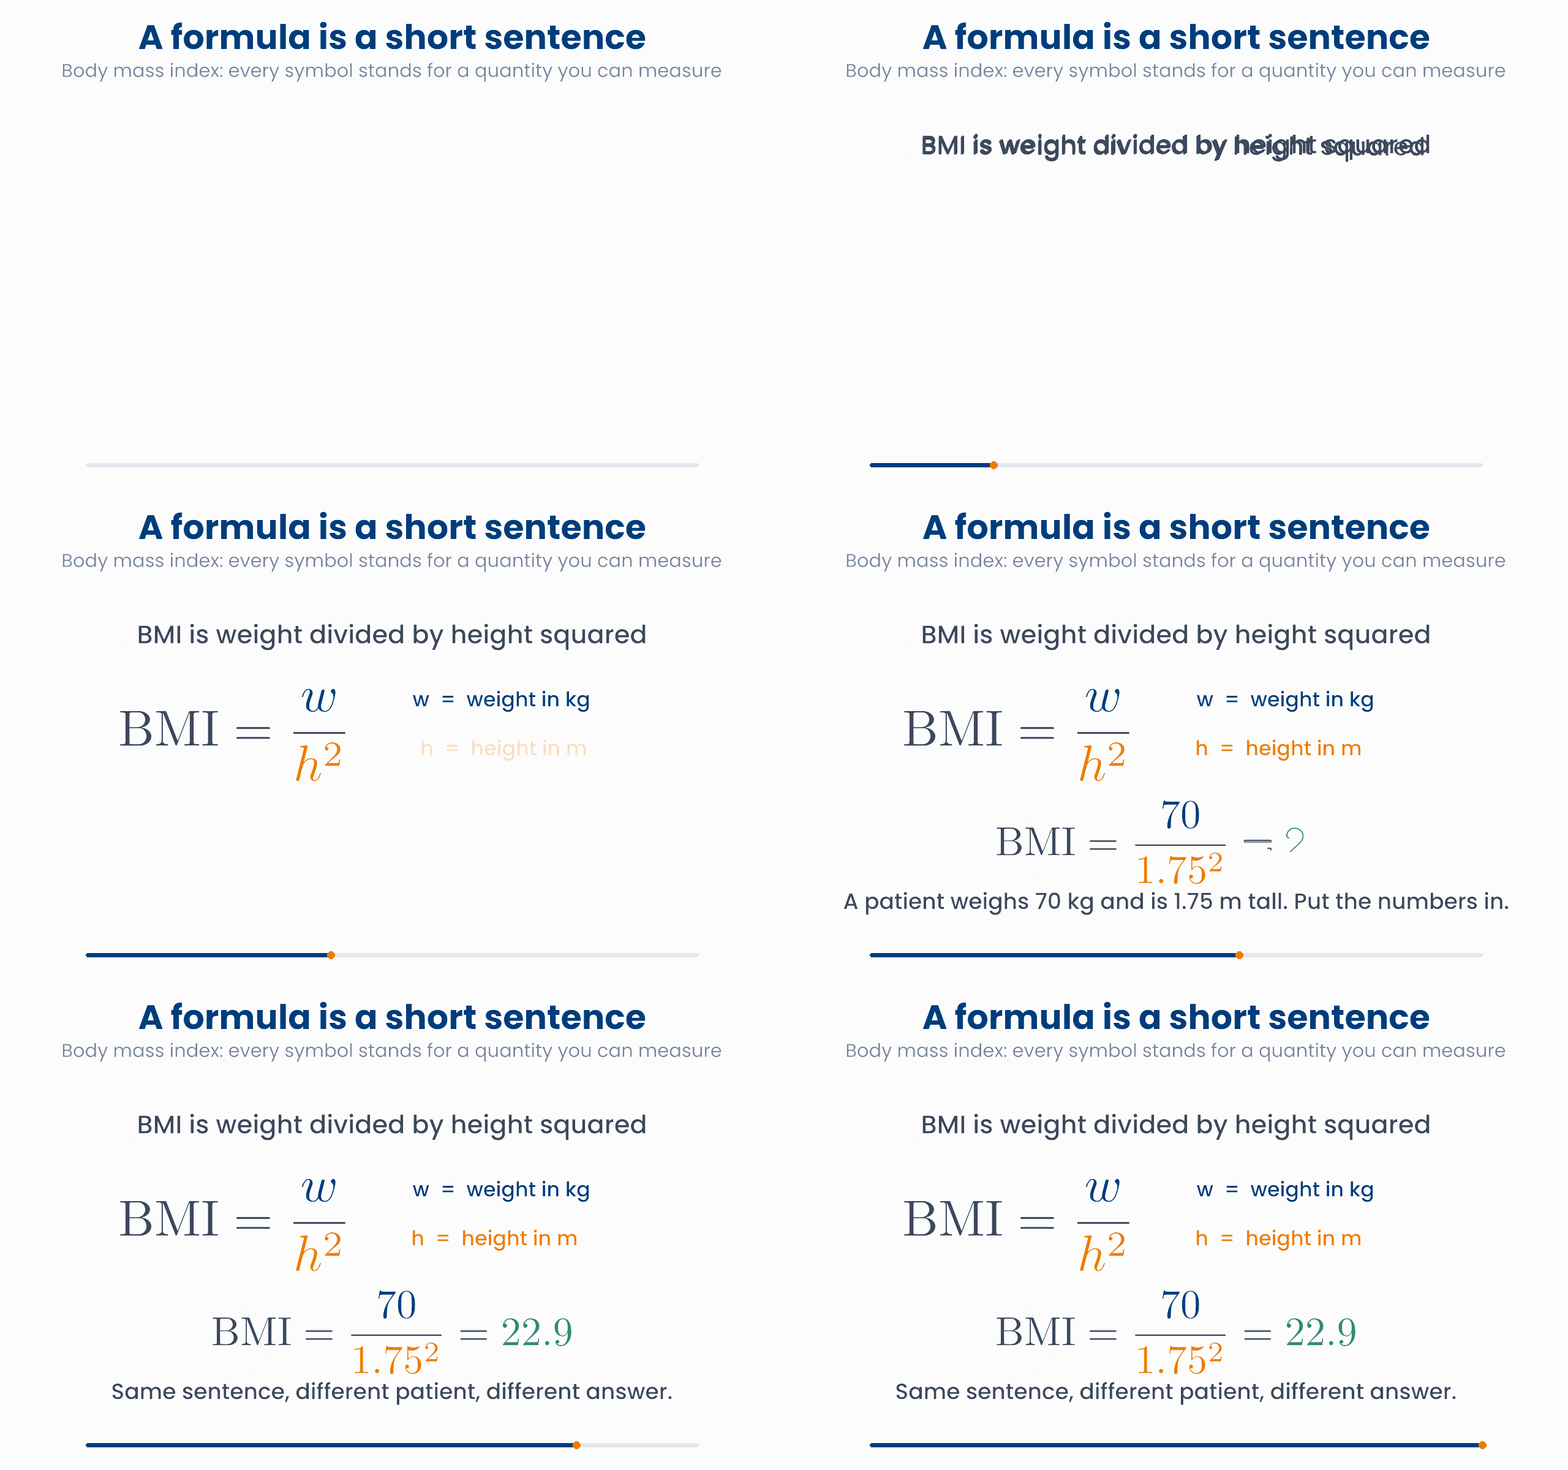
The body mass index (BMI) is a good first example. In words: BMI is weight divided by height squared. In symbols:
Here \(w\) is the weight in kilograms and \(h\) is the height in metres. The letters are variables. A variable is a name for a number that changes from patient to patient. The formula stays the same. Only the numbers you put in change.
What you will be able to do
- Say what \(x_i\) and \(x_{ij}\) mean in a table of patients.
- Read \(\sum\) as "add them all up" and \(\prod\) as "multiply them all".
- Take a formula apart from the inside out, as you will do with every formula in statistics and machine learning.
2 Variables and subscripts
A clinic measures the systolic blood pressure of five patients. We call the measurement \(x\). But there are five different values, so we need a way to say which patient. We write a small number below the line. This number is a subscript, or an index.
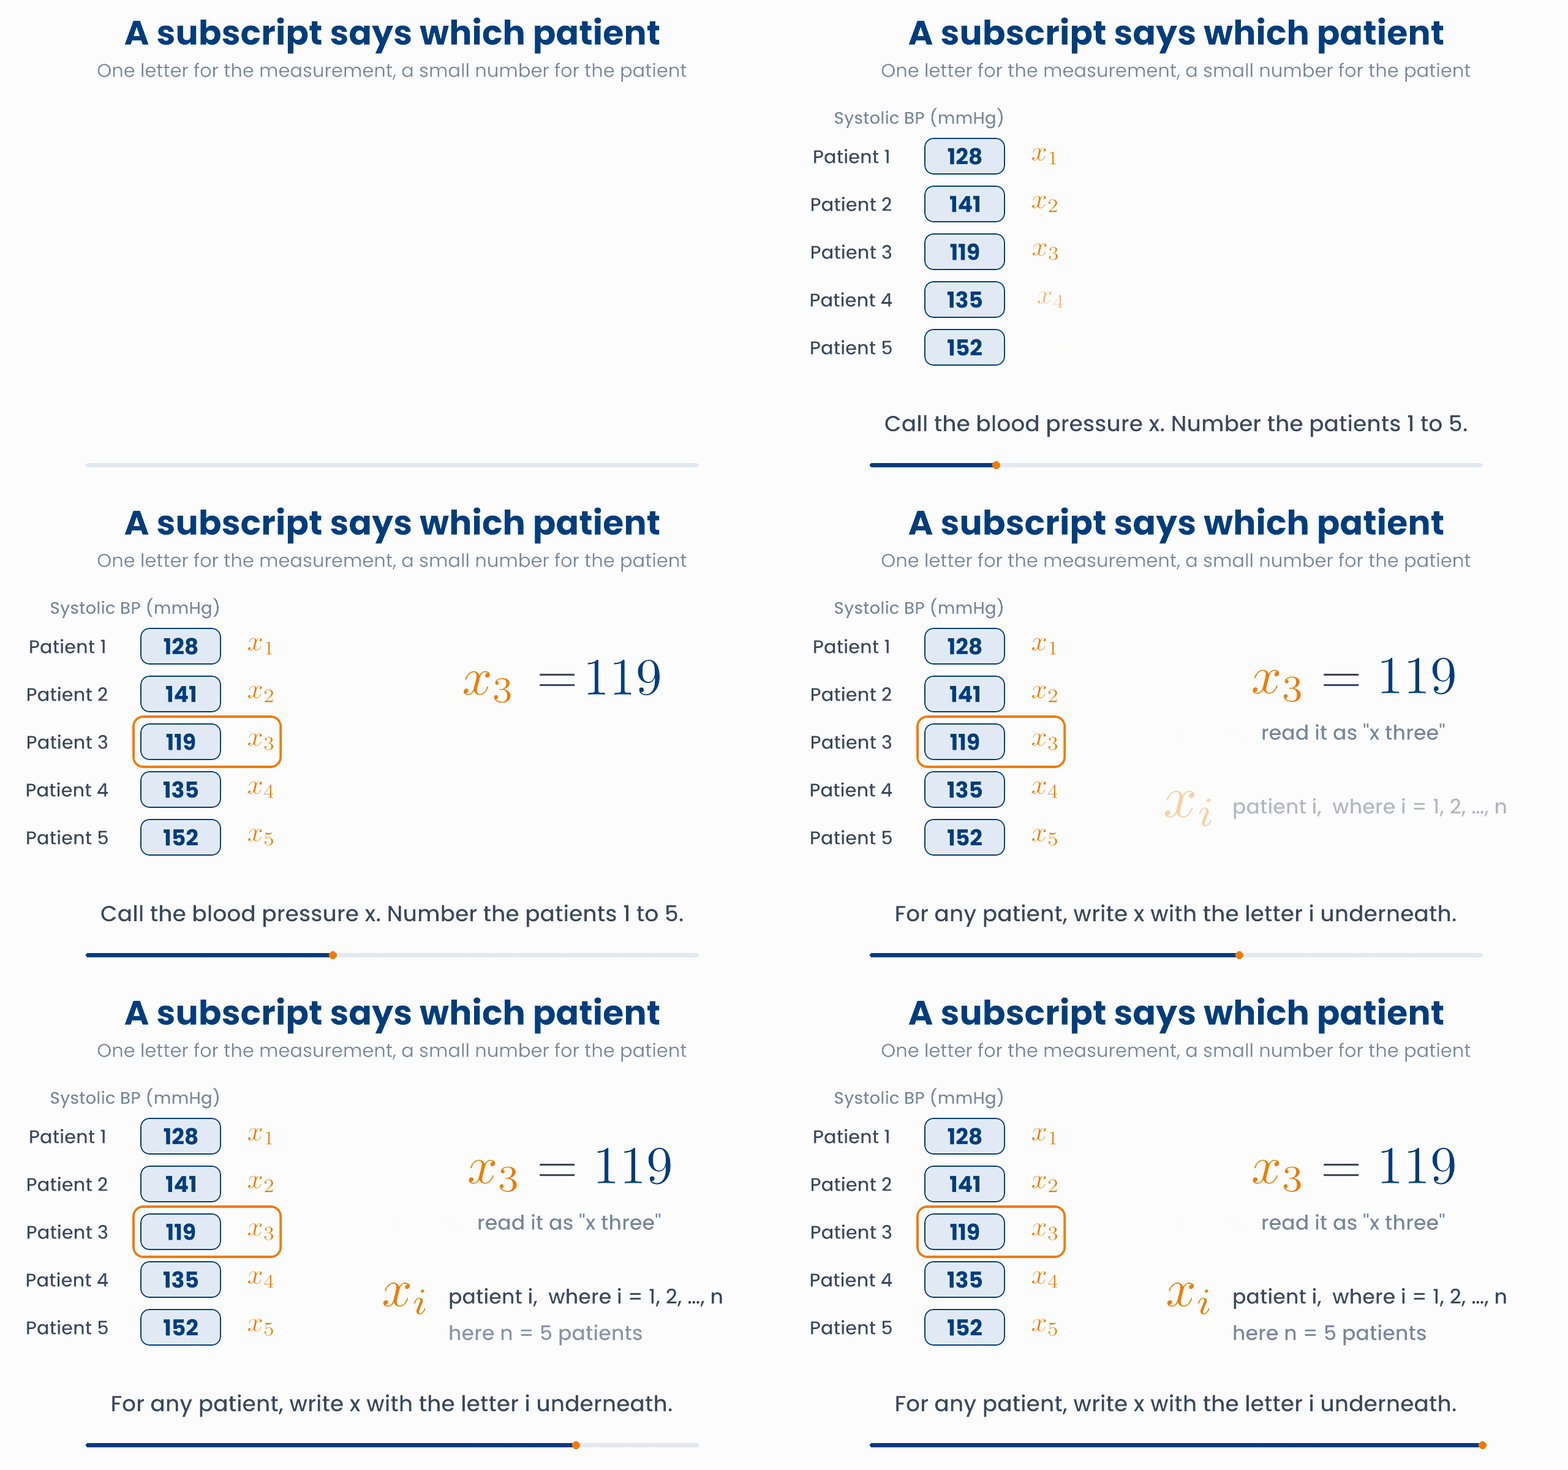
- \(x_1\) is the value for patient 1. Read it as "x one".
- \(x_3 = 119\) says that patient 3 has a blood pressure of 119 mmHg.
- \(x_i\) is the value for any patient. The letter \(i\) stands for "whichever patient we are talking about".
- \(n\) is the number of patients. Here \(n = 5\).
Pick a patient, read the symbol
Move the slider to change i. Watch which value x ᵢ points to.
Real data has more than one measurement per patient. Then we use two subscripts. The first says which patient (the row). The second says which measurement (the column).
Two subscripts: row, then column
Click any cell in the table. The symbol under the table is how a paper would name that one number.
You will meet this again
import numpy as np
x = np.array([128, 141, 119, 135, 152])
print(x[2])    # 119. Python counts from 0, so x_3 is x[2]
print(len(x))  # 5, this is n
Common mistake
x[0]. The index in code is always one less than the subscript in the formula.A table has one row per patient. The columns are: 1 = age, 2 = BMI, 3 = HbA1c. What does \(x_{52}\) mean?
3 Sigma: add them all up
The most common thing we do with a list of values is add them. For five patients we could write \(x_1 + x_2 + x_3 + x_4 + x_5\). For 5,000 patients that is not practical. So we use the capital Greek letter sigma, \(\Sigma\), which stands for sum.
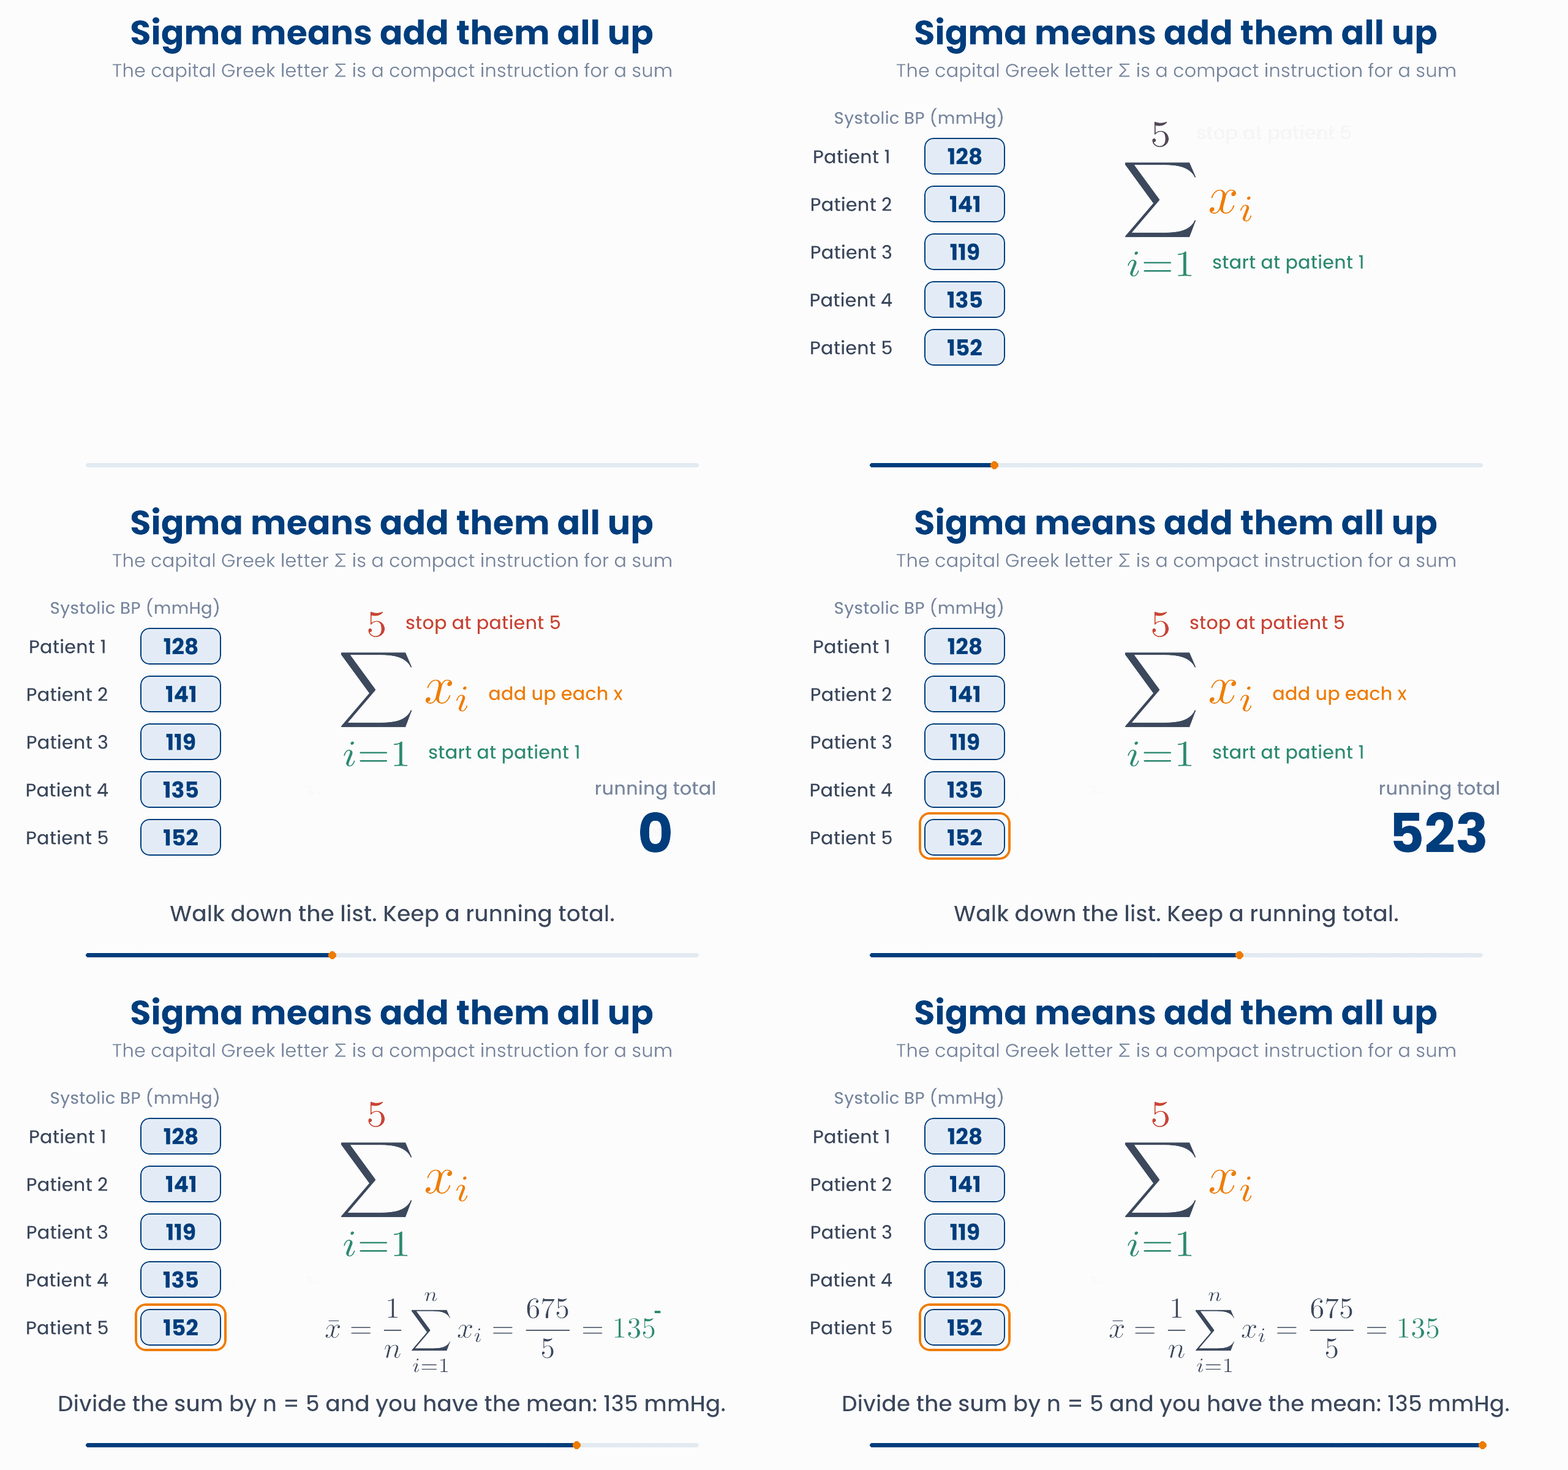
Read the symbol in three parts:
| Part | Where it is | What it tells you |
|---|---|---|
| \(i = 1\) | below the sigma | Start with patient 1. |
| \(n\) | above the sigma | Stop after patient \(n\). |
| \(x_i\) | to the right | This is the thing to add each time. |
If you write code, sigma is a for loop that keeps a running total.
Sigma is a loop with a running total
Drag the upper limit. The bars that are added turn blue, and the total and the mean update.
Now the formula from the start of the lesson is easy to read. The bar over the \(x\) means "the mean of \(x\)":
import numpy as np
x = np.array([128, 141, 119, 135, 152])

total = 0
for value in x:      # this loop is the sigma
    total += value
print(total)         # 675

print(x.sum())       # 675, the same thing in one step
print(x.mean()) # 135.0Four patients have fasting glucose values \(x_1 = 5,\; x_2 = 7,\; x_3 = 6,\; x_4 = 10\) mmol/L. What is \(\sum_{i=2}^{4} x_i\)?
4 Pi: multiply them all
The capital Greek letter pi, \(\Pi\), works the same way as sigma. But it multiplies, where sigma adds.
You will meet \(\Pi\) most often with probabilities. When events do not affect each other, the chance that all of them happen is the product of the single chances.
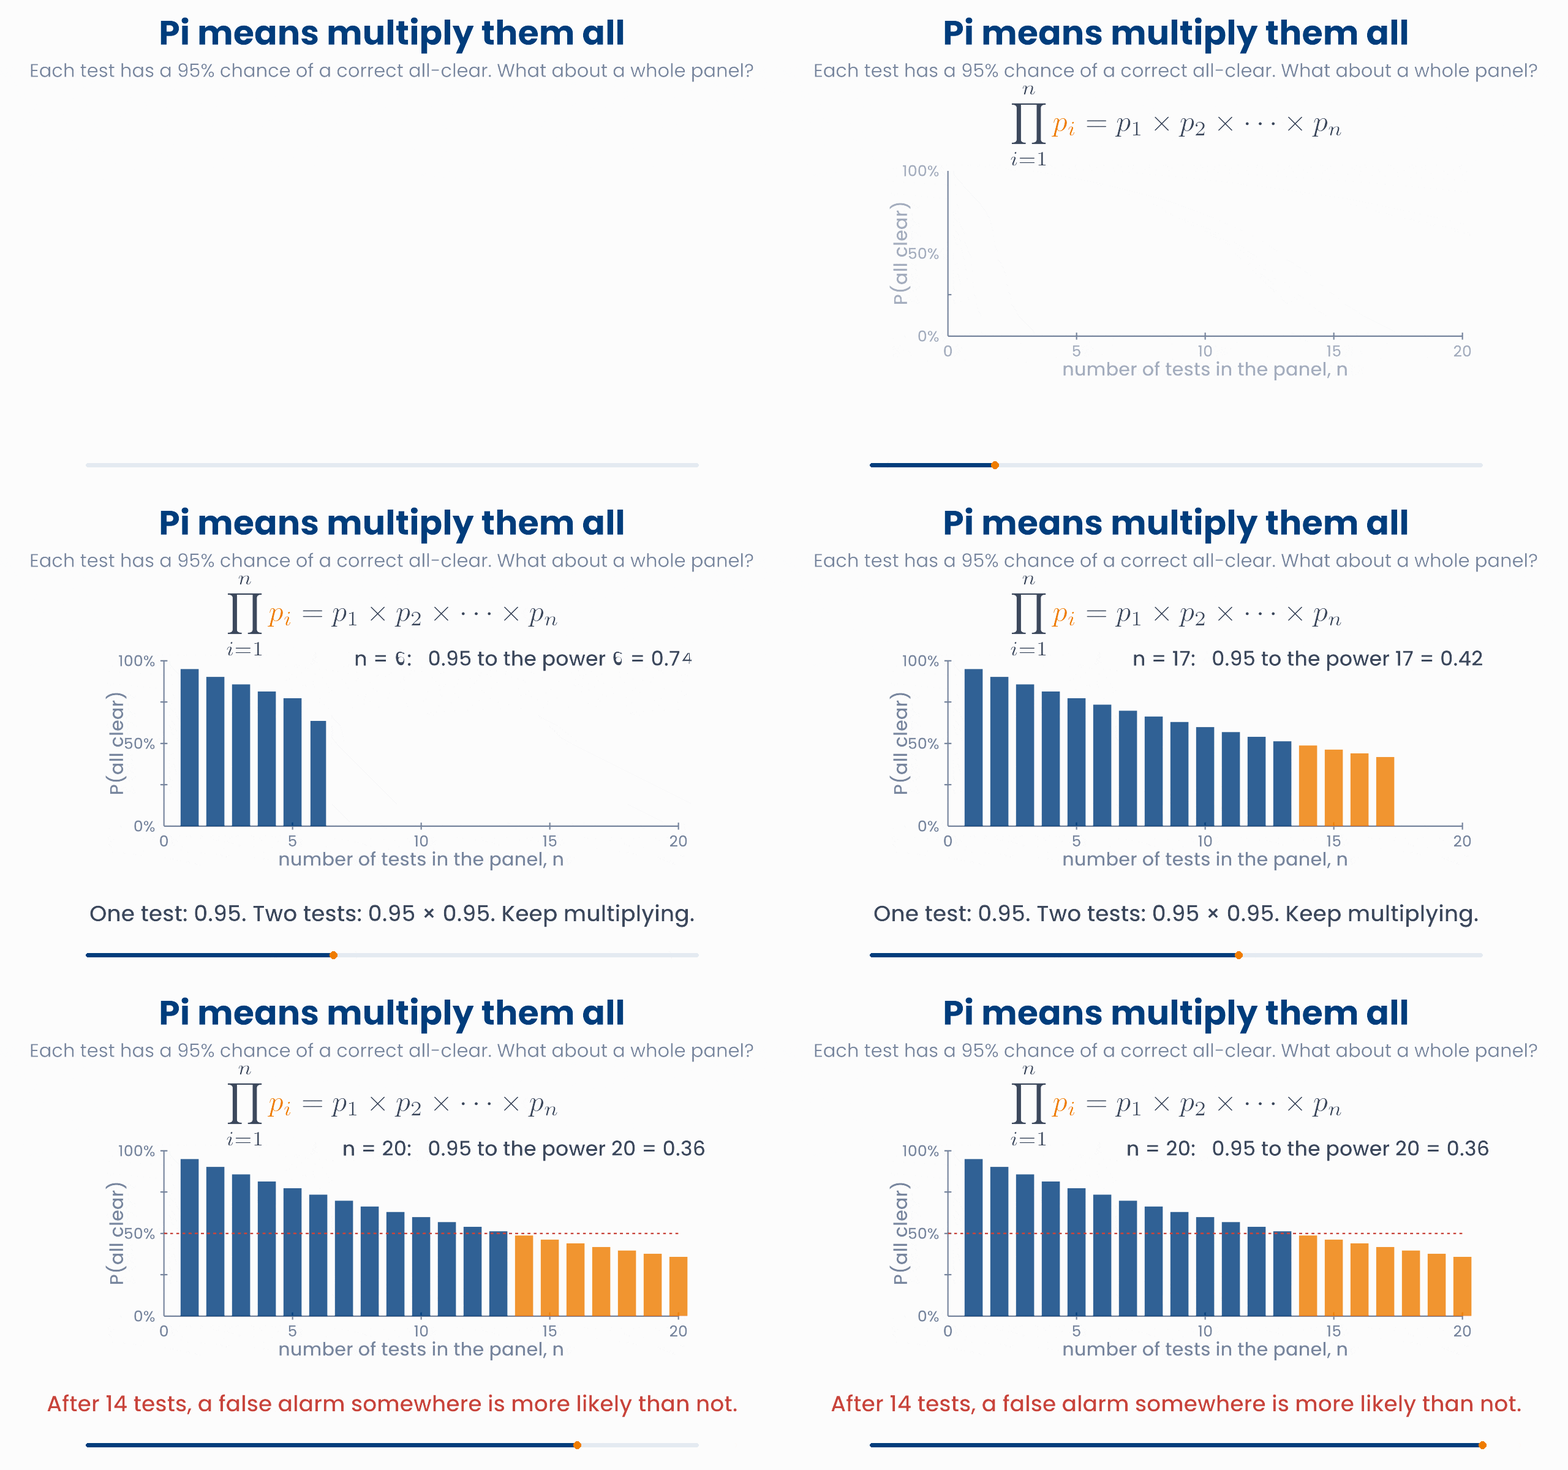
Here is why this matters in a clinic. Suppose a healthy person takes a blood panel. Each test in the panel correctly says "normal" 95% of the time. The chance that every test says "normal" is \(0.95 \times 0.95 \times \dots\), once for each test. The more tests you order, the more likely it is that at least one gives a false alarm.
How many tests before a false alarm is likely?
Change the number of tests and how reliable each one is. The orange curve is the chance of at least one false alarm in a healthy person.
Why you will care later
import numpy as np
p = np.full(12, 0.95)   # twelve tests, each correct 95% of the time
print(p.prod())         # 0.54  chance that all twelve are correct
print(1 - p.prod()) # 0.46 chance of at least one false alarmThree independent screening tests each have a 90% chance of correctly clearing a healthy person. Which expression gives the chance that all three clear them?
5 Reading a formula from the inside out
Long formulas are built from small parts. Do not read them left to right like a sentence in English. Start with the innermost part and work outwards. Here is the formula for the sample variance, which measures how spread out a set of values is:
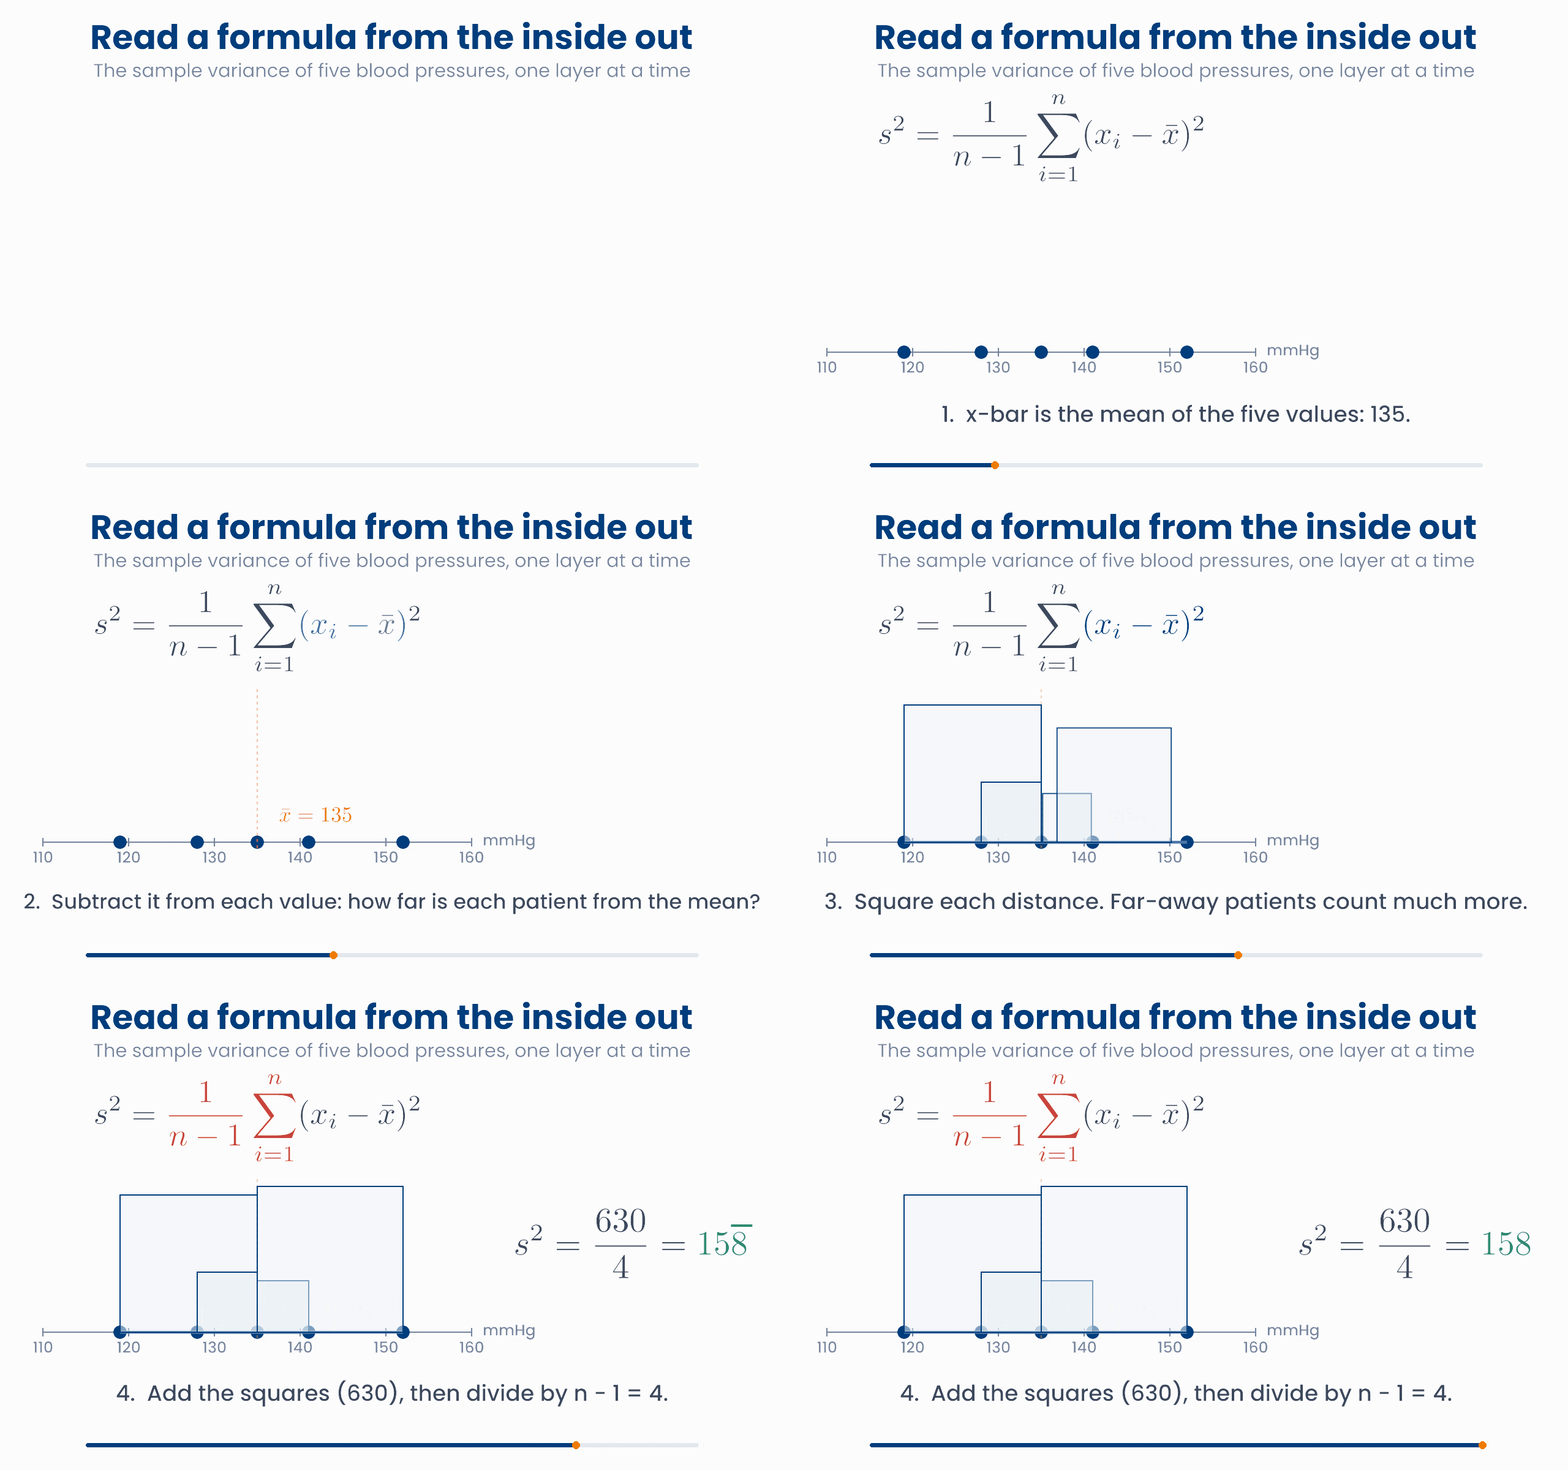
Take it apart in four steps
- \(\bar{x}\) is the mean of all the values.
- \(x_i - \bar{x}\) is how far patient \(i\) is from the mean. This is called a deviation.
- \((x_i - \bar{x})^2\) squares that distance. Squaring makes every term positive, and makes big distances count much more.
- \(\frac{1}{n-1}\sum\) adds the squares for all patients and divides by \(n - 1\). This is almost the average squared distance.
The square root of the variance, \(s\), is the standard deviation. It is back in the same unit as the data (mmHg here), so it is easier to talk about.
Drag a patient and watch the spread change
Drag any dot left or right. Each square has a side equal to that patient's distance from the mean. The variance is built from the total area.
Formulas also use a small set of marks and Greek letters again and again. You do not need to learn them all today. Come back to this table when you meet one.
| Symbol | Say it as | What it usually means |
|---|---|---|
| \(\bar{x}\) | x bar | The mean of the values you measured. |
| \(\hat{y}\) | y hat | A value that a model predicts, as opposed to the true value \(y\). |
| \(\mu\) | mu | The true mean of a whole population. |
| \(\sigma\) | sigma (small) | The true standard deviation of a population. \(\sigma^2\) is the variance. |
| \(\beta\) | beta | A coefficient in a model: how much the outcome changes when a measurement goes up by one. |
| \(\varepsilon\) | epsilon | Error, or noise: the part a model cannot explain. |
| \(\alpha\) | alpha | A chosen threshold, such as a 5% significance level, or a learning rate. |
| \(\lambda\) | lambda | A rate (events per unit time), or the strength of a penalty. |
| \(\in\) | in | "Is a member of". \(i \in \{1, \dots, n\}\) means \(i\) is one of the patients. |
| \(\approx\) | approximately | Nearly equal to. |
Key idea
import numpy as np
x = np.array([128, 141, 119, 135, 152])

dev = x - x.mean()                    # step 2: distance from the mean
print(dev)                            # [ -7.   6. -16.   0.  17.]
print((dev ** 2).sum() / (len(x) - 1))  # steps 3 and 4: 157.5
print(x.var(ddof=1))                  # 157.5, the same thing in one step
print(x.std(ddof=1)) # 12.55 mmHg6 Check your understanding
Five short questions on this lesson. Nothing is graded or saved outside this browser. If you choose a wrong option you get a hint, and you can try again.
In a study of \(n = 200\) patients, what does \(x_{17}\) refer to?
Which sentence is the correct reading of \(\displaystyle \frac{1}{n}\sum_{i=1}^{n} w_i\), where \(w_i\) is the weight of patient \(i\)?
A genome-wide study runs 10 independent tests. Each has a 99% chance of not giving a false positive. Which is the chance that none of the 10 gives a false positive?
In \(\displaystyle s^2 = \frac{1}{n-1}\sum_{i=1}^{n} (x_i - \bar{x})^2\), which part do you work out first?
A paper writes \(\hat{y}_i = 4.2\) and \(y_i = 5.0\) for the HbA1c of patient \(i\). What is the difference between the two symbols?